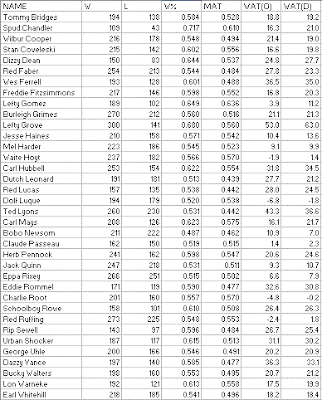
Again, we’ll begin with actual W-L record and percentage, along with Mate and WAT as figured by Oliver and Deane:

Here we have the first pitchers we have encountered who were worse then their teammates, two of them Hall of Famers: Waite Hoyt and Red Ruffing, along with Dolf Luque and Charlie Root. The reason that you can be worse then your teammates and still have a positive WAT figure according to Deane’s methodology is that the method is non-linear, and considering each season separately as I have here produces a different result then figuring the career as a whole. Both Ruffing and Hoyt would have negative WAT(D) if figured for the career as a whole.
Hoyt is an interesting case for other reasons; before doing this study, I had read that Ruffing was the only Hall of Famer with a worse record then his teammates. That is true, if you figure it as most people do. Waite Hoyt’s teams, when he did not pitch, were 2004-1654, for a .548 W%, while Hoyt was 237-166 for a .566 W%. But what I do is weight each season’s Mate by the percentage of career decisions the pitcher earned that year.
I think it is obvious that this is the logically correct way to do it, but I’ll do an example just to illustrate. Suppose there was a pitcher who went 10-10 on a 86-76 team one season, and 1-0 on a 70-92 team the next. His teammates without him would be 86 + 70 -10 - 1 = 145 and 76 + 92 - 10 = 158, for a .479 W%, while our pitcher is 11-10 for a .524.
But what sense does it make to treat equally a season in which he recorded 20 decisions with one in which he recorded 1? Absolutely none. So I would say that his career Mate is 20/21*(86/162) + 1/21*(70/162) = .526. And so this pitcher is actually worse then his teammates.
In the first edition of the Historical Baseball Abstract, Bill James figured WAT by the Oliver method for a number of pitchers, and listed Career Mate as well. I don’t know why our figures diverge in many cases, but they do. For instance, he lists Hoyt’s Mate as .587, while I say it is .570 by my method and .548 by the incorrect method. Perhaps he was weighting by games or innings or something, I don’t know. Or it could be a data entry error on my end. Anyway, we do agree for a number of pitchers, so I think he was using a logical process, but I’d like to find the cause of this divergence. Anyway, it does appear that he did think about this problem the same way I did, and came to the same (IMO common sense) conclusion.
And the Wood/Patriot methodology results:

Here we lose our first 300 game winner, with Lefty Grove dropping out of the club, while still towering over his contemporaries and putting up the best NW% we’ve yet encountered. As a matter of fact, Grove has the highest NW% for any retired pitcher I’ve checked (limiting it to pitchers with 150 neutral wins--Spud Chandler’s .662 in just 152 decisions is higher), but is currently behind three active major league pitchers--it remains to be seen whether they can maintain their standing as they age (I will save their identities for a later installment, but I would think that you figure out for yourself who they are, or at least list a small group of current pitchers that they must be drawn from).
Dolf Luque skates on thin ice, narrowly avoiding the dishonor of being the first sub-.500 NW% pitcher I included in my list.
No comments:
Post a Comment
I reserve the right to reject any comment for any reason.