For the last several years I have published a set of team ratings that I call "Crude Team Ratings". The name was chosen to reflect the nature of the ratings--they have a number of limitations, of which I documented several when I introduced the methodology.
I explain how CTR is figured in the linked post, but in short:
1) Start with a win ratio figure for each team. It could be actual win ratio, or an estimated win ratio.
2) Figure the average win ratio of the team’s opponents.
3) Adjust for strength of schedule, resulting in a new set of ratings.
4) Begin the process again. Repeat until the ratings stabilize.
The resulting rating, CTR, is an adjusted win/loss ratio rescaled so that the majors’ arithmetic average is 100. The ratings can be used to directly estimate W% against a given opponent (without home field advantage for either side); a team with a CTR of 120 should win 60% of games against a team with a CTR of 80 (120/(120 + 80)).
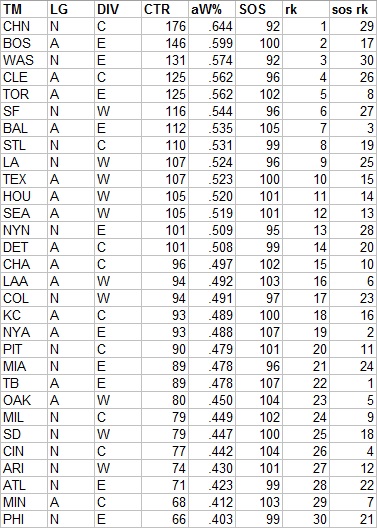
First, CTR based on actual wins and losses. In the table, “aW%” is the winning percentage equivalent implied by the CTR and “SOS” is the measure of strength of schedule--the average CTR of a team’s opponents. The rank columns provide each team’s rank in CTR and SOS:

The top ten teams were the playoff participants, with the two pennant winners coming from the group of three teams that formed a clear first-tier. The #9 and #10 teams lost the wildcard games. Were it not for the identity of the one of those three that did not win the pennant, it would have been about as close to perfect a playoff outcome as I could hope for. What stood out the most among the playoff teams to me is that Arizona ranked slightly ahead of Washington. As we’ll see in a moment, the NL East was bad, and as the best team in the worst division, the Nationals had the lowest SOS in the majors, with their average opponent roughly equivalent to the A’s, while the Diamondbacks’ average opponent was roughly equivalent to the Royals.
Next are the division averages. Originally I gave the arithmetic average CTR for each divison, but that’s mathematically wrong--you can’t average ratios like that. Then I switched to geometric averages, but really what I should have done all along is just give the arithemetic average aW% for each division/league. aW% converts CTR back to an “equivalent” W-L record, such that the average across the major leagues will be .50000. I do this by taking CTR/(100 + CTR) for each team, then applying a small fudge factor to force the average to .500. In order to maintain some basis for comparison to prior years, I’ve provided the geometric average CTR alongside the arithmetric average aW%, and the equivalent CTR by solving for CTR in the equation:
aW% = CTR/(100 + CTR)*F, where F is the fudge factor (it was 1.0005 for 2017 lest you be concerned there is a massive behind-the-scenes adjustment taking place).

The league gap closed after expanding in 2016, but the AL maintained superiority, with only the NL West having a higher CTR than any AL division. It was a good bounceback for the NL West after being the worst division in 2016, especially when you consider that the team that had been second-best for several years wound up as the second-worst team in the majors. The NL East was bad, but not as bad as it was just two years ago.
I also figure CTRs based on various alternate W% estimates. The first is based Expected W%, (Pythagenpat based on actual runs scored and allowed):

The second is CTR based on Predicted W% (Pythagenpat based on runs created and allowed, actually Base Runs):

Usually I include a version based on Game Expected Winning %, but this year I’m finally switching to using the Enby distribution so it’s going to take a little bit more work, and I’d like to get one of these two posts up before the end of the year. So I will include the CTRs based on gEW% in the Run Distribution post.
A few seasons ago I started including a CTR version based on actual wins and losses, but including the postseason. I am not crazy about this set of ratings, the reasoning behind which I tried very poorly to explain last year. A shorter attempt follows: Baseball playoff series have different lengths depending on how the series go. This has a tendency to exaggerate the differences between the teams exhibited by the series, and thus have undue influence on the ratings. When the Dodgers sweep the Diamondbacks in the NLDS, this is certainly additional evidence that we did not previously have which suggests that the Dodgers are a stronger team than the Diamondbacks. But counting this as 3 wins to 0 losses exaggerates the evidence. I don’t mean this in the (equally true) sense that W% over a small sample size will tend to be more extreme than a W% estimate based on components (R/RA, RC/RCA, etc.) This we could easily account for by using EW% or PW%. What I’m getting at is that the number of games added to the sample is dependent on the outcomes of the games that are played. If series were played through in a non-farcical manner (i.e. ARI/LA goes five games regardless of the outcomes), than this would be a moot point.
I doubt that argument swayed even one person, so the ratings including playoff performance are:

With the Dodgers holding a 161 to 156 lead over the Astros before the playoffs, romping through the NL playoffs at 7-1 while the Astros went 7-4 in the AL playoffs, and taking the World Series to seven games, they actually managed to increase their position as the #1 ranked team. I’m not sure I’ve seen that before--certainly it is common for the World Series winner to not be ranked #1, but usually they get closer to it than further away.
And the differences between ratings include playoffs (pCTR) and regular season only (rCTR):

Monday, December 18, 2017
Crude Team Ratings, 2017

Monday, January 23, 2017
Crude Team Ratings, 2016
For the last several years I have published a set of team ratings that I call "Crude Team Ratings". The name was chosen to reflect the nature of the ratings--they have a number of limitations, of which I documented several when I introduced the methodology.
I explain how CTR is figured in the linked post, but in short:
1) Start with a win ratio figure for each team. It could be actual win ratio, or an estimated win ratio.
2) Figure the average win ratio of the team’s opponents.
3) Adjust for strength of schedule, resulting in a new set of ratings.
4) Begin the process again. Repeat until the ratings stabilize.
The resulting rating, CTR, is an adjusted win/loss ratio rescaled so that the majors’ arithmetic average is 100. The ratings can be used to directly estimate W% against a given opponent (without home field advantage for either side); a team with a CTR of 120 should win 60% of games against a team with a CTR of 80 (120/(120 + 80)).
First, CTR based on actual wins and losses. In the table, “aW%” is the winning percentage equivalent implied by the CTR and “SOS” is the measure of strength of schedule--the average CTR of a team’s opponents. The rank columns provide each team’s rank in CTR and SOS:

Last year, the top ten teams in CTR were the playoff participants. That was not remotely the case this year thanks to a resurgent gap in league strength. While the top five teams in the AL made the playoffs and the NL was very close, St. Louis slipping just ahead of New York and San Francisco (by a margin of .7 wins if you compare aW%), the Giants ranked only fifteenth in the majors in CTR. Any of the Mariners, Tigers, Yankees, or Astros were considered stronger than the actual NL #3 seed and CTR finisher the Dodgers.
The Dodgers had the second-softest schedule in MLB, ahead of only the Cubs. (The natural tendency is for strong teams in weak divisions to have the lowest SOS, since they don’t play themselves. The flip is also true--I was quite sure without checking to verify that Tampa Bay had the toughest schedule). The Dodgers average opponent was about as good as the Pirates or the Marlins; the Mariners average opponent was rated stronger than the Cardinals.
At this point you probably want to see just how big of a gap there was between the AL and NL in average rating. Originally I gave the arithmetic average CTR for each divison, but that’s mathematically wrong--you can’t average ratios like that. Then I switched to geometric averages, but really what I should have done all along is just give the arithemetic average aW% for each division/league. aW% converts CTR back to an “equivalent” W-L record, such that the average across the major leagues will be .50000. I do this by taking CTR/(100 + CTR) for each team, then applying a small fudge factor to force the average to .500. In order to maintain some basis for comparison to prior years, I’ve provided the geometric average CTR alongside the arithmetric average aW%, and the equivalent CTR by solving for CTR in the equation:
aW% = CTR/(100 + CTR)*F, where F is the fudge factor (it was 1.0012 for 2016 lest you be concerned there is a massive behind-the-scenes adjustment taking place).

Every AL division was better than every AL division, a contrast from 2015 in which the two worst divisions were the NL East and West, but the NL Central was the best division. Whether you use the geometric or backdoor-arithmetric average CTRs to calculate it, the average AL team’s expected W% versus an average NL team is .545. The easiest SOS in the AL was the Indians, as to be expected as the strongest team in the weakest division; it was still one point higher than that of the toughest NL schedule (the Reds, the weakest team in the strongest division).
I also figure CTRs based on various alternate W% estimates. The first is based on game-Expected W%, which you can read about here. It uses each team’s game-by-game distribution of runs scored and allowed, but treats the two as independent:
Next is Expected W%, that is to say Pythagenpat based on actual runs scored and allowed:

Finally, CTR based on Predicted W% (Pythagenpat based on runs created and allowed, actually Base Runs):

A few seasons ago I started including a CTR version based on actual wins and losses, but including the postseason. I am not crazy about this set of ratings, but I can’t quite articulate why.
On the one hand, adding in the playoffs is a no-brainer. The extra games are additional datapoints regarding team quality. If we have confidence in the rating system (and I won’t hold it against you if you don’t), then the unbalanced nature of the schedule for these additional games shouldn’t be too much of a concern. Yes, you’re playing stronger opponents, but the system understands that and will reward you (or at least not penalize you) for it.
On the other hand, there is a natural tendency among people who analyze baseball statistics to throw out the postseason, due to concerns about unequal opportunity (since most of the league doesn’t participant) and due to historical precedent. Unequal opportunity is a legitimate concern when evaluating individuals--particularly for counting or pseudo-counting metrics like those that use a replacement level baseline--but much less of a concern with teams. Even though the playoff participants may not be the ten most deserving teams by a strict, metric-based definition of “deserving”, there’s no question that teams are largely responsible for their own postseason fate to a much, much greater extent than any individual player is. And the argument from tradition is fine if the issue at hand is the record for team wins or individual home runs or the like, but not particularly applicable when we are simply using the games that have been played as datapoints by which to gauge team quality.
Additionally, the fact that playoff series are not played to their conclusion could be seen as introducing bias. If the Red Sox get swept by the Indians, they not only get three losses added to their ledger, they lose the opportunity to offset that damage. The number of games that are added to a team’s record, even within a playoff round, is directly related to their performance in the very small sample of games.
Suppose that after every month of the regular season, the bottom four teams in the league-wide standings were dropped from the schedule. So after April, the 7-17 Twins record is frozen in place. Do you think this would improve our estimates of team strength? And I don’t just mean from the smaller sample, obviously their record as used in the ratings could be more heavily regressed than teams that played more games. But it would freeze our on-field observations of the Twins, and the overall effect would be to make the dropped teams look worse than their “true” strength.
I doubt that poorly reasoned argument swayed even one person, so the ratings including playoff performance are:

The teams sorted by difference between playoff CTR (pCTR) and regular season CTR (rsCTR):

It’s not uncommon for the pennant winners to be the big gainers, but the Cubs and Indians made a lot of hay this year, as the Cubs managed to pull every other team in the NL Central up one point in the ratings. The Rangers did the reverse with the AL West by getting swept out of the proceedings. They still had a better ranking than the team that knocked them out, as did Washington.
Monday, February 21, 2011
Comments on Bill James Gold Mine 2010, pt. 1
I quite enjoyed the third edition of the Bill James Gold Mine, even though I didn't get around to reading it until a few months after it was published. It jogged some thoughts, which lead to this post, which is not fully based on James' essays but on the semi-related paths they sent my mind down. To me, that is one of the tests of a really good sabermetric work--does it get you thinking, even if not about the exact topics covered? James' book passed that test for me.
However, I do think that the book would be stronger if it contained more of James' essays and less "statistical nuggets". The nuggets were of less interest to me, and seemed to be present in lesser quantity than they were in the first two editions of the book. The reverse was true for the essays, and those are what compel me to buy the book. Not being a subscriber to Bill James Online, I'm not positive about this, but I believe that James writes a number of additional essays in each year that are not included in the book.
If that is indeed the case, I believe that they'd be much better off to collect all of Bill's essays in the Gold Mine, and leave the nuggets for the individual to drudge up themselves online. Not only does the website lend itself more to the statistics (the data there is much more extensive than what can be printed in the book even if the book were the size of one of the old Great American Baseball Stat Books) and the essays to the printed page, but if there are any folks out there who still refuse to use the Internet and are interested in James, I'd think they'd be more enticed by the essays. A book of just the essays, with some other filler of some sort, would have a character not unlike that of the 1990-1992 Baseball Books, which I liked very much.
Of course, since it appears that the book is not even being published in 2011, those suggestions are for naught.
I have three subjects to touch on, two of which could be considered critiques and one of which is just a good old-fashioned tangent. This post went a lot longer than I originally intended so it's been broken up into two portions:
1. Starting pitcher rankings
The longest essay in the book deals with a system to rate starting pitchers based on where they place among other starters in each of their league seasons. James first ranks pitchers by Season Score (*), and then assigns points based on the pitcher's standing in the league. Each league season has 5.5 points per team available. In a fourteen team league, the top ranked pitcher gets 12 points, the #2 ranked pitcher gets 11 points, and so on down to the #11 pitcher who gets 2 points. There are also three-point bonuses, up to nine points per season, available for truly historic seasons. The resulting metric is called Strong Season points.
(*) James does not give the formula for Season Score in the article, but explains that is based on W, L, IP, ERA, K, W, and SV. "The point of the system is to evaluate a pitcher's record without context"..."This was a way of trying to say 'How good are the numbers themselves?', rather than 'How good was the pitcher who compiled these numbers?'".
Personally, I'm not sure that I have a whole lot of interest in rankings of pitchers based on a method that deliberately ignores context (and James certainly does not deny the importance of context). Setting my objection aside, though, it seems to me as if the Season Score is yet another result of a process that James has repeated over the course of his career: the re-invention of Approximate Value. Of all of his methods, my impression is that there is none that James personally likes more than AV. Even Win Shares is in some respects a return to AV--while it attempts to adjust for everything, it still expresses the result in an integer. The scale is higher than that of AV (a 20 AV would be an extraordinary season, while 20 WS is good but ordinary).
And so after attempting to adjust for everything, it seems James still had a void in his own toolkit, and so he filled it with the Season Score.
Digression aside, James found that a career total of 43 strong season points marks a fairly clear line for the Hall of Fame in retrospect. Only five pitchers retired for a significant length of time have more than 44 points and are not in the Hall--Vida Blue, Bert Blyleven, Ron Guidry, Carl Mays and Billy Pierce. James says that Blyleven and Guidry (60 points) are the only two pitchers that were far above 43 yet are excluded from Cooperstown. (Blyleven has been elected since James wrote the book and I wrote this post, obviously).
Since Guidry's is the most surprising result of James' survey, I'll take a closer look at him. I do not intend the discussion about Guidry to be a commentary on his Hall worthiness or even his value, but rather as a means of discussing the issue I have with the strong season method. It is important to note that James does not in any claim that the strong season method must be used in ranking pitchers, that it is better than any methods X, Y, and Z, or any such thing. James does not argue that Guidry should be in the Hall of Fame because of his showing in the system.
Guidry earned points for six seasons in James' analysis--1977-79, 1982-83, and 1985. Suppose we apply James' method, but use a different metric--a simple Runs Above Replacement, figured using total runs allowed and adjusted for park. How many points would Guidry earn under such a system?
* James ranked Guidry #6 in the AL in 1977, which is worth seven points. I have him #7, worth six points.
* James and I both have Guidry #1 in 1978 with an extraordinary season for 12 points (James awards the 9 point bonus, and I'll do so as well to keep things comparable). Guidry turned in 101 RAR, seventeen more than the next closest pitcher and nine more than any other AL pitcher in any of these six years.
* James had Guidry #3 in 1979 for ten points. I have him second, for eleven points.
* James ranks Guidry #11 in 1982 for two points. I have him all the way down at #26. His RA was 4.22 in a league in which 4.5 runs were scored per game, and he pitched in a moderate pitchers' park (.97 PF). At 34 RAR, he is eleven runs behind the eleventh-place pitcher (Geoff Zahn, 45). Presumably Season Score gives Guidry a boost because of his 14-8 record, one of the most impressive in the league (seventh in the league in Win Points).
* James ranks Guidry #4 in 1983 for nine points; I have him #6 for seven points.
* James ranks Guidry #2 in 1985 for eleven points; I have him #11 for two points. This is another season in which Guidry's W-L record seems to give him a huge season score boost (22-6).
Add it all up, and I have Guidry at 47 points--suddenly not that far above the Hall of Fame line James observed. I followed his scoring method exactly, but the results changed significantly simply by changing ranking methods.
More interesting, IMO, is how the use of in-season rank elevates the importance of very small performance differences. In 1979, Guidry ranked second in RAR at 71. However, Tommy John (71) and Jerry Koosman (70) were right behind him. Given that Guidry relied much less on his fielders, I strongly support the notion that he had a better season than the other lefties. Still, negligible differences in actual performance are given much greater impact when one uses a points system like James'.
Another example is 1985, in which Guidry ranks eleventh on my list at 61. Jimmy Key ranks sixth at 62--there are six pitchers within two RAR of each other. Guidry could very easily rank sixth in this season, which would be worth an additional five points. That would vault him from 47 points to 52 points, and give him a great deal more clearance over the HOF line.
This is not to say that James' ranking system is without its strong points with respect to its aims--it values peak performance and it sets an equal total value relative to the size of the league, which depending on one's perspective might be very good properties. My contention is that such a system is very sensitive to small changes in statistics, ones that would have no impact on a career-based evaluation. If Guidry had been evaluated at 62 RAR and thus sixth in 1985, the extra run saved would have zero impact on your evaluation of his career RAR total--and rightfully so. Allowing one run to exert a significant difference in a player's rank on an all-time list strikes me as utterly illogical and unsatisfactory.
You may object and say that I am using RAR rather than Season Score, and that Season Score is not subject to minute differences in performance having a large effect on rank order as is the case for RAR. While it is true that RAR and Season Score are very different methods, and that their application to Guidry might be very different as well, any metric is going to be subject to the same concerns when making a rank order over one season. There is always the potential that a very small margin could be the difference between a batting title and third place, between fifth in the league on a list and out of the top ten. That is true for any metric you want to pick, from BA to home runs to ERA to Season Score to RAR.
Tuesday, August 03, 2010
Meanderings
* When the Indians played at the Phillies in June, multiple outlets reported that this was the Indians' first-ever regular season game in Philadelphia. It seems that the source of this was the Indians' own media notes on the game, and many of the outlets simply passed along this information. That's reasonable enough--one should have a reasonable degree of confidence in the information put out by the team, and not have to fact check everything.
On the other hand now, I would hope that someone would recognize that the claim the Indians had never before played in Philadelphia is absurd on its face. The Indians shared the American League with the Philadelphia A's for fifty-three seasons.
Of course, the note could have been easily corrected by changing it from "in Philadelphia" to "at the Phillies". My incredulity, mild as it is, comes not from the incorrect tidbit of trivia, but from the ignorance of history on behalf of people report about baseball for a living.
Granted, it's not particularly relevant to reporting on modern baseball to know about a team that hasn't played in that city in nearly sixty years, and it could just be a simple oversight, which we are all prone to at one time or another (quick: find a factual error in this post!) On the other hand, it has always seemed to me that people who make their living writing about or commenting about or compiling data about baseball would be big enough baseball fans to be aware of a franchise that won five World Series and featured luminaries like Connie Mack, Lefty Grove, Eddie Collins, Home Run Baker, ...
This phenomenon is not limited to the specific example of the A's--it's something that gnaws on me occasionally when I hear people talk. The Indians' play-by-play man, Tom Hamilton, is sometimes revealed to be somewhat ignorant of National League rookies or Korean and Taiwanese baseball, for instance. The best defense of professionals might be that they do this for a living, and so rather than being a fun diversion, it's a job. It still seems a little odd to me.
* I could be way off base on this next observation--it certainly wouldn't be the first time that I made a faulty generalization. (Also, I don't want to get bogged down in the identities of the players discussed. If you think I've mischaracterized the career of George Brett, then feel free to substitute someone else in his place). However, it seems to me as if the average fan, when evaluating great players, is not draw to the extreme poles of peak or career but rather to extreme performances on either pole. So he won't pick Sandy Koufax as one of his top pitchers, with his career-preferring double picking Nolan Ryan--he'll pick both Koufax and Ryan, because he's impressed by the extreme peak and the extreme career.
The result of this is a bewildering middle ground, in which Pete Rose and Sandy Koufax are simultaneously voted on the All-Century team (I am not saying that the silly All-Century vote confirms my theory; that vote would be completely consistent with people belonging to extreme career or extreme peak camps, and simply balancing each other out in the public at large. It also did not boast a particularly well designed voting system or an informed electorate. I may be using it as evidence, but am admitting that it could easily be used by someone arguing against me as well, or dismissed as meaningless). If you are an extreme career voter, then there's no way in hell you can believe that Sandy Koufax was one of the ten best pitchers of all-time. And if you're in the extreme peak camp, it makes no sense to believe that Pete Rose is the sixth-best outfielder of all-time.
However, if what is going on is that fans are impressed by one extreme or the other, then picking Koufax and Rose can be explained. I still don't think it makes a lot of sense, because taking a dual extremes positions excludes the players who were really good in their peaks and really good in their careers--which is the bulk of the great players in history.
The other complicating factor is that the average fan when evaluating a career probably looks at bulk totals rather than baselined value. When I talk about career value, I almost always mean career value above replacement. Just staying around and compiling only counts to the extent that you can exceed replacement level, and so the last few years of Pete Rose's career have no impact on my evaluation of him. But for those who are looking at career through the lens of totals, Rose's last years often are a strong positive (4,000 hits!)
The very greatest, of course, had tremendous peaks and tremendous career totals--Cobb, Ruth, Bonds, etc. There are some great players that had very good peaks but extraordinary career totals--Hank Aaron, for instance. There are some great players that had great peaks but only good career totals--say Pedro Martinez. And then there is the bulk of great players--guys like Mel Ott or George Brett . If you draw up your list by either extreme, these guys are not going to be at the very top. But if you evaluate by some combination of peak and career, these guys will rank comfortably ahead of one-trick ponies like Koufax.
* The five no-hitters thrown continue to be one of the driving factors behind the "Year of the Pitcher" storyline that the media has run with. But what is the probability of observing five or more no-hitters in a season?
I was going to write about applying the Poisson distribution to this question, but happily discovered that there have been multiple pieces that already covered that ground (see Bob Brown's article "No-Hitter Lollapaloosas Revisited" in the 1996 Baseball Research Journal, this post at Bayes Ball (great blog name, BTW), this one at Tom Flesher's blog, and this paper by some folks from Middlebury College's Econ department).
Since these folks have already done the legwork, I'm not going to offer a justification for this approach (they are much better qualified to do so in any event, so I'll refer you there). Based on the data in Flesher's post, the observed probability of a no-hitter from 1961-2009 is 120/201506 = .0006.
So far this season, there have been 3,166 games played in the majors (through 8/2, and counting each game twice since each is an opportunity for a no-hitter). The mean is .0006*3166 = 1.9 no-hitters. The Poisson probability for x observations is:
P(x) = e^(-mean)*mean^x/x!
So:

The first column gives the probability of observing x no-hitters; the second column gives the probability of observing at least x no-hitters. You can see that there is a 3.1% of observing exactly five no-hitters and a 4.4% chance of observing exactly five no-hitters, at least based on this Poisson model with a .0006 probability of a no-hitter in any individual game.
Of course, this model assumes that the probability of a no-hitter is fixed at the observed level over the last fifty or so seasons, regardless of changes in league environment. To crudely estimate a more 2010-specifiic probability, consider that the overall ML BA is .2594; the 1961-2009 average was .2597. This season is pretty much in line with the average BA from which the sample data comes.
Of course, the sample is just that, so we can figure a rough probabilistic estimate of no-hitter frequency. If a pitcher needs to record y outs to get a no-hitter, and each at bat is treated as independent, then the probability of a no-hitter is (1 - BA)^y. Of course each at bat is not truly independent, and each batter doesn't have the same BA, and you can add some other objections.
If you use 27 as y, you will definitely underestimate the frequency of no-hitters, as many no-hitters don't actually require 27 batting outs--there are outs made on the bases, outs made by sacrifices which don't figure into BA, etc. If you do what I am going to do, and set y = 25.2, which is the average number of batting outs per game, you're not considering that there are generally less non-batting outs when there are less baserunners.
Using .2594 and y = 25.2, the estimate probability of a no-hitter is (1 - .259)^25.2 = .00052, which over 3,166 games yields a mean of 1.64 no-hitters. Using that mean, the Poisson probabilities are:

Neither of these approaches is foolproof, but they both indicate that it is not extremely unlikely to see five no-hitters over 3,166 games.
As an aside, it's well-known that the Mets have never had a no-hitter in franchise history, covering 7,742 games (again, through 8/2). Using the Poisson approach and a .0006 probability (which ignores the quality of Mets pitching, park effects, etc.), the mean is 4.65, and the probability of zero is just .961%.
Using a binomial approach, the probability of zero is (1 - .0006)^7742 = .959%, and you can see that the Poisson matches the binomial very well. It is much easier to work with, though, especially when dealing with non-zero observations. If we wanted to know the probability that the Mets had pitched seven no-hitters, we'd have to compute C(7742, 7)*(.0006)^7*(1-.0006)^(7742-7), which a spreadsheet can handle but it's a big mess. The binomial estimate for the probability of seven Met no-nos is 8.90%, which is the same as the Poisson estimate.
I'll leave you with that; probability of x no-hitters for the Mets franchise:

Sunday, July 25, 2010
The Next Great Sabermetric Hall of Fame Cause
Occasionally sabermetrically-inclined people will get behind a Hall of Fame candidate, generally one who has overwhelming qualifications from one perspective or another, but for whatever reason don't resonate as well with the mainstream. Rich Lederer's tireless campaign for Bert Blyleven is the most prominent (and successful), and the Tim Raines group of Jonah Keri, Nate Sager, Tango Tiger, and the late John Brattain has put together a website for their now Andre Dawson-endorsed cause. Alan Trammell certainly has his advocates, although they are not nearly as well-organized. Both Robbie Alomar and Barry Larkin debuted with a high enough percentage that there's no particular sense of urgency to make their case.
Blyleven is very likely to be voted in 2011, which should free up some people's quota of HOF arguing time. I have an early suggestion for you on where to invest it, if you're into that sort of thing. It's quite possible that I'm off-base, and that this player will be viewed more favorable by the BBWAA than I imagine. I admittedly don't have a particularly good handle on the mainstream baseball consensus.
Perhaps it's a sign of how out of touch I am that the comment I'm about to describe even raised my eyebrow. Tom Hamilton, the Indians' play-by-play announcer, described this player as a guy who "might be a borderline Hall of Famer". Had it just been "might" or "borderline", I probably wouldn't have thought as much of it, just chalking it up to laziness. But "might" and "borderline"? As in, "If this guy gets in, he's still more like Jim Rice than Carl Yastrzemski"?
Before I go any further, it must be acknowledged that this player performed in the 90s-00s, and thus will be written off by many because of steroids. So be it; there's no changing any minds on that issue.
The player I speak of is Jeff Bagwell, and he'll be on the ballot for the first time this year. I'm suggesting that if you would like to be the next Rich Lederer, you should get a head start. The day the vote is taken, the blogosphere will be overrun with posts about how badly the BBWAA missed on Bagwell. This is your chance to get ahead of the curve and stake out your territory.
From the sabermetric perspective, it's hardly worth even making the case for Bagwell. He ranks 35th all-time among position players in Chone's WAR, essentially equal with Ken Griffey. The only post-1900 first baseman ahead of him are Gehrig and Foxx (the great ABC trio of the nineteenth-century also ranks ahead of Bagwell). My own figures agree with that assessment. His peak seasons (probably 1994, 1996-1999) are impressive.
However, it's not too difficult to see why Bagwell might be underappreciated by the mainstream. Among the explanations:
1. While Bagwell compiled impressive triple crown numbers during his big seasons, he was a big secondary average guy who looks even better through the lens of advanced metrics. As you'll see below, his adjusted runs scored and RBI rates are much closer to equal than many other great first baseman, and RBI get all the attention (which is not to suggest that Bagwell's RBI rates were anything but outstanding).
2. Bagwell's best season, 1994, was shortened by a hand injury and the strike. The strike was probably fortuitous in his case, as he would not have been the NL MVP had the season continued with him out of action. I'm not suggesting that his 1994 be counted as a full season, and I don't think he requires any dispensation for it. Without it, though, he's missing what would have been a monster season around which to build his case.
3. The end of Bagwell's career was cut short by shoulder problems. His last full season came at age 36, one in which he was still an above-average performer and hit 27 homers. Without injury, it's a pretty safe assumption that he'd have reached 500 homers.
Of course, he didn't, and again I'm not suggesting that he should be credited for doing so. However, getting to 500 would have given him one of the key milestones that shape mainstream perception of career value.
4. Bagwell spent his peak in a fairly strong pitcher's park. The Astrodome park factor ranges from 94-97 during his years playing there (1991-99). The erstwhile Enron Field was a hitter's park, driving Bagwell's career park factor up to a close-to-neutral 98, but the Astrodome disguised some of his peak value.
5. To some extent, Bagwell is associated with poor post-season performances, compiling a .226/.364/.321 line. One has to put a lot of stock in 129 PA to significantly change their evaluation of him on that basis, though.
Earlier this year, I looked at measures of runs and RBI per out relative to the league average. The point was not to suggest that these were superior to context-neutral metrics like runs created, but to put R and RBI totals in context, at least up to a sabermetric minimum (considering outs made and league scoring context). Bagwell's R and RBI, considered in this light, give a similar view of his value as advanced metrics.
Bagwell's runs scored per out relative to the league average (R+) was 153, which would rank fourth among post-1900 Hall of Fame first baseman, trailing only Gehrig, Chance, and Foxx. His RBI per out relative to the league (RBI+) of 163 is nearly as impressive; it would rank seventh, behind Gehrig, Greenberg, Foxx, Mize, McCovey, and Killebrew. The average of the two (which I called Runs Anything and abbreviated as ANY) is 158, which would rank fifth, trailing Gehrig, Greenberg, Foxx, and Mize.
I'll allow you to peruse the chart yourself and draw your own conclusions (or not, as the case may be), but I think it's fair to say that Bagwell's R and RBI figures are very much in line with the other great first baseman. Of course, ANY is not really a stand-in for mainstream analysis, despite being fueled by R and RBI. It does not fit that role, since it recognizes the fundamental principle of sabermetrics with respect to offense: that offense occurs within the context of outs.
When I have had occasion to discuss ranking players with non-saberites, I have often said something like "I'll accept for the sake of argument that R and RBI are appropriate measures of a player's offensive production." However, I refuse to waver on insisting that league context and outs be considered. In the case of Bagwell, league context is not a particularly important factor either way--the NL average R/G of 4.57 for his career is fairly normal. His OBA was outstanding, though, even when compared to great first baseman of history.
It's possible that I'm wrong, and that Bagwell is appreciated by the BBWAA voters and will debut at a percentage that makes future induction a solid bet. If so, any would-be Bagwell Lederers out there will have wasted their time and I will have cried wolf. I'd like for that to be the case, for Bagwell's sake if nothing else.
Bagwell and some other first basemen:

Tuesday, July 14, 2009
Meanderings
Meanderings are what you get when I either have no coherent ideas for a post or a number of things I want to write about that are all insufficient to fill out a full post. Other times, like this time, it's just a collection of junk thrown together.
* The recent deaths of Ed McMahon, Farrah Fawcett, and Michael Jackson within a few days of each other revived one of my least favorite memes--people dying in threes. I realize that very few people, if anyone, actually takes this sort of thing seriously, and really thinks that if two celebrities die today that movie studios should be contacting their insurance companies. Still, it is a perfect example of how multiple endpoints and loose definitions can lead to some awfully silly things being said.
The endpoints are wide open, as this adage never defines what the period is in which the three deaths should occur. Obviously, if you wait long enough, you will be able to group at least six billion people together in death. Practically, though, it leaves it open until the third person you need to form your group dies. Had Michael Jackson died three days later than he did, he still could have been in the group. If he was still alive and well, then people could have reached back in time for David Carradine, or waited around for Steve McNair and Robert McNamara. No matter.
The loose definition of such groups is also apparent. That they are reasonably well-known is the only qualification. Certainly Michael Jackson's fame outshined the other two, but they are in the group all the same. There was no need to wait around for two other people of Jackson's notoriety. If time had gone by and no one else of note had died, I'm sure somewhat would have dug through the obituaries and found a lesser-known individual to include in the group.
* Speaking of silliness, how about ESPN's 20 Year All-Star team, covering the twenty years that ESPN has been broadcasting MLB games? They have been showing the nominees for various positions during the Monday and/or Wednesday night games, opening up an internet poll throughout the week, and then announcing the winners on Sunday Night Baseball.
Obviously any time you let internet voting occur without any sort of screening or restrictions, you are bound to get some silly results (remember the pitiful All-Century Team that didn't include Hans Wagner among others?) So it's not worth criticizing the selections themselves, and it would be hard to do so anyway because they are the result of a disparate group of individual choices.
However, the whole exercise illustrates why I don't like this kind of exercise when the time period is restricted arbitrarily (obviously ESPN had its reasons for using twenty years, but it has no particular baseball significance). The selection of Nolan Ryan as top right-handed pitcher is illustrative of one of the biggies. Leaving aside the fact that Ryan has been lionized and overrated by many ordinary fans, with his strikeout and no-hit feats overshadowing the more mundane aspects of the game like preventing runs and winning games, and accepting for the sake of argument that Ryan is one of the five or ten greatest pitchers of all time, it is patently absurd to suggest that he is the best right-handed pitcher of the last twenty years, given that he only pitched in four of them...
...Unless you look at it from the perspective of "best to play in this period, period". Since Ryan played in the twenty-year period, he's eligible, and he's a reasonable choice within the bounds of this idiosyncratic viewpoint (remember, above we agreed to accept the premise that Nolan Ryan was one of the very greatest pitchers in history). I don't think this is what most people have in mind when they look at a question like this--do you want to put Cal Ripken or Tony Gwynn on an all-00s team?
There's the middle ground, which would be something like "I'll consider someone if they played a significant amount in the period, whether or not they actually have a case to being the best in that period." From this perspective, you could justify a vote for Cal Ripken on the 20-year team, because he was played in roughly half of the seasons and was still productive in most of them.
And then there's the literalist definition of twenty years, in which only performance within the period is taken into consideration, and thus it is getting dicey when you argue for Nolan Ryan over Dan Haren, let alone Greg Maddux or Mike Mussina. While most people will gravitate towards one of the latter two definitions, these types of exercise usually leave it open-ended, and the results are as much a question of how you approach the exercise as they are a judgment on any of the players involved.
There will be a rash of this stuff coming up near the end of the season and over the winter as the decade ends (Or does it? Even that is not so easy to define). I'll be over here with my fingers in my ear, yelling "STOP!" in vain, thank you very much.
* I love the MLB Network, and think it knocks ESPN's socks off in every aspect of broadcasting, analysis, game coverage, ...except one. Statistics.
The stats displayed on-screen on MLB Network, either during games or on MLB Tonight, are pathetic. I think the standard line for starting pitchers is W-L, ERA, K, and W. That's not so bad except for the omission of innings, which are sorely needed to contextualize the last three categories.
For hitters, though, you get BA, HR, R, and RBI. No plate appearances (or even at-bats). No OBA or SLG. They do display the OBA, SLG, and OPS leaders sometimes on MLB Tonight, but that's about it.
ESPN is running circles around them in this department. The standard batter line when watching a game on ESPN is BA/HR/RBI/OPS, with OBA, SLG, and OPS in tiny print at the top of the screen (at least until the at-bat starts and they are replaced by the always captivating "after x-y count" stats).
* You always see the barb that "you don't watch the games" directed at sabermetricians, and this is often coupled with the "living in your parents' basement" type of stereotype that adds up to nothing more than "sabermetricians are losers". You know, socially maladjusted folks who think girls have cooties and stand in the corner at any sort of social gathering they are roped into attending.
Obviously this argument is not even worth attempting to refute. However, the implicit assumption is kind of funny--that watching a large amount of baseball games makes one cool. After all, this argument is usually advanced by fans, not baseball professionals who are paid to watch and attend games. To the public at large, people who watch a lot of baseball games are probably not considered to be at the top of the social hipness scale. So the whole "watching games" argument (even if one was to accept the premise that sabermetricians don't watch games) really boils down to the Star Trek fans telling the Star Wars fans that they are losers.
* I am embarrassed to say that I was unaware that Steve Phillips attended the University of Michigan. Suddenly, it all makes sense.
Monday, February 02, 2009
The Ten Years War
For once, I’m going to attempt to be early to address a topic instead of late. I am usually pretty reactionary; something will happen, everyone in the world will weigh in on it, and then I come in a month later when no one cares anymore (not that my take on it would have been particularly interesting if it were timely). This time, I hope to beat the rush by six or seven months.
Since we are now in 2009, I believe it is safe to assume that we will be treated to a number of pieces on “X of the decade”. The team of the decade, player of the decade, trade of the decade, left-handed sidearming reliever of the decade, etc. This is all well and good, and harmless enough; there’s nothing wrong with frivolous baseball discussions and there’s certainly nothing wrong with putting things in (short) historical perspective.
The key word is “frivolous”. Once the question is allowed to take on greater significance (like being used as a Hall of Fame argument, with Jack Morris as “Pitcher of the Eighties” (*) the prime example), then I have problems with it.
Being the best over a ten-year period is certainly a noteworthy accomplishment. The problem is that the decade approach to issue emphasizes one particular period over all others. Take for instance the fact that Mark Grace led MLB in hits for the 1990s (he had 1,754, seven more than Rafael Palmeiro). In fairness, if anyone has used this to proclaim Grace’s greatness, it has not gained much traction, but still, it sounds a lot more impressive than it actually is. The next six men on the list (Palmeiro, Biggio, Gwynn, Alomar, Griffey, and Ripken) all had more career hits than Grace.
Yes, the list is for hits in the 1990s, not career hits, but this is not a case of getting Grace plus a bunch of guys near the end of their careers or just getting started. With the exception of Ripken and possibly Gwynn, the 1990s were the prime decade for all of them (and Ripken and Gwynn were both productive throughout the decade). It just so happens that for those ten seasons, Grace had a few more hits.
If you look at the ten years from 1989-1998, Grace is third with 1,731 hits, 46 behind Gwynn. The ten years from 1991-2000? Grace (1,715) and Palmeiro (1,719) trade places. So what is it exactly that makes the ten year period from 1990-1999 more important than periods offset by just one year on either side? “The ‘90s” sounds a lot better than “the ten years beginning with ‘89”, but there is no real distinction. By picking out “the ‘90s”, we get the one ten year period in which Mark Grace happened to lead the league in hits. It would be much more impressive is if you could find a player who led the league in hits over multiple ten-year periods. By not examining any other time period, Grace is held up as a singular player, when he should be viewed in a group with other ten-year hit leaders around the same time (for the ten year period beginning with 1988, the leader is Molitor; 1989--Gwynn, 1990--Grace, 1991--Palmeiro, 1992--Alomar).
Organizing history into workable periods can be helpful, but doing it based on endpoints that happen to make a nice numerical cohort (namely, the same digit in the tens place) is a crude way of doing so. If you intend to put any stock in the exercise, why not go through the trouble of dividing time on the basis of important changes in the game? It might be helpful to start a new “era” of baseball history sometime around the middle of the 90s, with events like the strike, the offensive explosion, the influx of Asian talent, the two expansions, and the purported steroids era all as possible markers of a historical shift. I’m not advocating placing too much stock in this sort of classification (for the purposes of establishing statistical leaders, not constructing a historical narrative), either, but if you must break up time into rigid segments, I believe it’s a better way to go.
I’ve been assuming throughout that the “decade” is a natural way to divide time, but who can forget the fascinating (**) arguments that erupted over what constitutes the decade? This issue popped up a lot in 1999 and 2000 as people debated when the third millennium actually began. Since there is no year zero AD (CE if you must, but if you must, please leave), if you actually start counting off ten years to define your decades, the first would be years 1-10, which would eventually lead you to 2001-2010 as the current decade. Furthermore, there’s really nothing to stop you from re-centering the entire calendar of Western Civilization and declaring that the year we call 34 BC should be year 1, and starting from there.
Don’t get me wrong; I have no qualms about calling this the year 2009. The preceding digression is just intended to drive home the point that no specific ten year period is inherently significant solely because of the digits we use to represent it.
In that vein, George Brett’s Hall of Fame plaque includes the tidbit that he was the “first player to win batting titles in three decades (1976, ’80, ’90). There have been objections to this statement on the grounds I described above--a non-negligible portion of observers claim that ’76 and ’80 are in the same decade. Regardless, it’s a fairly impressive feat, but what impresses me about it is that he had batting titles separated by fourteen years, not that the three each fell in a different decade. That’s a long time to be a candidate to lead the league in anything.
However, Ted Williams won batting titles separated by seventeen years (’41 and ’58), and Stan Musial matched Brett at fourteen (’43 and ’57). Brett still has one of the longest gaps between first and last titles, but it’s no longer a historical oddity. And Williams and Musial both won a bunch of them, not just three, the bare minimum needed to have any chance at three decades. The distinction I draw is that Brett’s feat is an ok trivia question, but a really stupid thing to put on someone’s Hall of Fame plaque.
Another issue raised by the decade family of questions is sort of related to the classic career v. peak value issue. Let’s say we were going to pick the player of the ‘00s, as of this moment (I’m writing this in January). Should our pick be the player who contributed the most value over the course of the decade? Should it be the player who was the most valuable in his decade prime, whether he played for the whole decade or not? Should it be the best player, over the course of a full career, for whom this was his most productive decade, even if somebody was more productive in this decade. If you use the first definition, then Jack Morris is a *potential* choice for pitcher of the 80s, and Roger Clemens is probably a poor choice. If you use the second definition, then Clemens or Dwight Gooden is probably your guy (please don’t argue with me on the specific names here; I don’t care and I didn’t check to see which I would pick if I had to). If you use the third definition, you could make an argument along the lines of “I think Hank Aaron was more valuable than Willie Mays in the 1960s, but I also think Mays was a more valuable player over the course of their entire careers, and therefore Mays is the player of the ‘60s.”
If you think it should be the player who added the most value in the decade, period, then what do you do about Albert Pujols (let alone Barry Bonds)? Ignoring fielding (but considering position), I have Alex Rodriguez at 70 WAR and Pujols at 71 WAR for 2000-2008 (those figures are a little higher than most, because I’m using a lower RPW than most people; the specific numbers aren’t really the point). That is too close to call, but consider that Pujols did not play at all in 2000. What if ARod was at 75 WAR and Pujols at 71? That’s still well within a margin of error, but it would make it makes ignoring ARod’s advantage a little tougher. A one win difference is easy to waive off with “He did that in eight seasons rather than nine, but one extra season of 4 WAR is a darn good season.
Another point which should be obvious but that I’ll mention anyway is that the used of a fixed decade period can be a boon to players based on their birthdays. ARod, born in 1975, went from 25 to 34 in the 00s. This is a good ten-year stretch to have considered, as it safely includes his expected peak seasons and avoids seasons in which he would be very young or very old. What about a player like Hanley Ramirez, though? Born in 1983, the 00s are his age 17-26 seasons. And the 10s will be his age 27-36 seasons. Even if Ramirez is the best something (shortstop, maybe even player) in the majors over a legitimate stretch, there is a non-negligible chance that he will never be the “shortstop of the decade” simply because of how his age corresponds to the definition of decade in use.
I chose to highlight ARod/Pujols precisely because it’s so close that it’s easy to justify Pujols if you’d like. But what happens when the difference in playing time is more profound? I previously mentioned Roger Clemens v. Jack Morris for “pitcher of the 80s”. Do Clemens’ brilliant seasons make him better, or do you go with Morris because it’s hard to take a 95-45 pitcher over a 162-119 pitcher? We can all agree that Clemens was a much greater pitcher than Morris, and over each of their best ten-year periods, but if we limit ourselves strictly to just 1980-89, we almost are forced to honor Morris and not Clemens.
The career v. peak issue is a legitimate one, one which is largely a matter of personal preference and on which many reasonable people arrive at very different preferences. Why muddy the waters even more by forcing comparisons into arbitrary timeframes?
My protestations aside, the end of the year figures to yield an explosion of “X of the decade” stories. Hopefully, they will be offered in the spirit of fun, not profundity, and everything will be kept in perspective. The good news is that it’s just baseball, not a war, and so the worst thing that can happen is that we get treated to a number of ridiculous and overly serious choices from the media and groups of fans. Like the Sporting News choosing Pete Rose as “Player of the ‘70s” over two superior teammates. Or the players selecting Ken Griffey, not Barry Bonds, as “Player of the ‘90s”. And who could forget the “All-Century Team”, in which a group of experts had to be impaneled to avoid leaving Lefty Grove, Christy Mathewson, Stan Musial, Warren Spahn, and Hans Wagner off the team in favor of Sandy Koufax, Nolan Ryan, Ken Griffey, Bob Gibson, and Ernie Banks? I’ll embrace these opportunities to chuckle, even as I shake my head at the thought-process that generates them.
(*) Tango wrote a piece for the Hardball Times about Jack Morris and the “Pitcher of the Eighties”, which addresses the arbitrary definition of a decade and the silly emphasis placed on it.
(**) Fascinating in the sense of arguing over the pronunciation of "tomato".
The National Pastime Almanac is a very handy tool for answering questions like “Who had the most hits between years X and Y”, and it was the source for the data in this piece. If you are not a database whiz and like to fiddle around with the numbers, I highly recommend it. And it’s free.
Monday, October 15, 2007
Cy Young Award
Continuing to pick the award winners and set my IBA ballot (yes, I know the deadline to vote already passed, but this is pre-written), let’s move on to the Cy Young Award. Starting in the superior league, I think there are five candidates that stand out, all starters: Josh Beckett of Boston, CC Sabathia and Fausto Carmona of Cleveland, John Lackey of Los Angeles, and Johan Santana of Minnesota. Eric Bedard was on pace to rank right up there with them, but injury held him to 182 innings and kept him out of the running.
This is one of the closest Cy Young races that I can recall in some time. I remember the 1997 NL race as being a real doozy, and last year’s NL race was well-contested as well. This one ranks up there with them. Let’s start by picking Cleveland’s top pitcher. Sabathia worked twenty six more innings than Carmona, and trailed him in RA (3.58-3.33), eRA (3.83-3.61), and Quality Start Percentage (74-81). He did enjoy a substantial advantage in FIP (3.67-4.42), although since they had the same defense behind them, this does not carry as much weight with me as it might. Overall, Carmona was +37 versus average and +67 versus replacement; Sabathia was +35 and +68.
This race is too close to call by the numbers, and so my judgment call is to go with CC. I try not to buy in to the talk about “leadership” and being a “stopper” and the like, but Sabathia is the Indians’ ace. He draws the ball for the opening playoff game, he is a veteran, he strikes more batters out. If you want to see it the other way, be my guest, but I go with Sabathia.
So how does Sabathia match up to the others? He leads Lackey and Beckett by three RAR and Sabathia by eight, although Beckett edges him by one run when compared to average. These razor-thin differences are essentially meaningless, and so it again comes down to a judgment call. Beckett led in RA by .3, but Sabathia tossed 41 more innings. That means that Sabathia is equivalent to Beckett plus a pitcher with 41 innings and a 5.07 RA. Considering that the league average was a 4.90 RA, this replacement is a guy you’d like to have lying around to fill in on your staff. The difference between Sabathia and Lackey is a seventeen inning pitcher with a 3.71 RA.
That approach is equivalent to RAR, but it just frames the differences in a different perspective. I think that the extra innings are valuable, and do put Sabathia ahead, however so slightly. He is my choice, but I can accept any of the top four.
In such a tight race, some people will begin to put more emphasis on factors that often can be safely ignored, like the quality of opposition faced. I am not sure that this is appropriate. Clearly, for determining who is of better ability or who is more likely to pitch better in the future, the quality of opposition is important. However, when it comes to value, I think one can make a case either way.
Comparing to a baseline pitcher, it is clearly true that the hypothetical pitcher will allow a different number of runs depending on the type of hitters he faces. However, regardless of what kind of opposition you face, a win is a win. If the Indians faced a worse average opponent than the Red Sox, this may provide us with evidence that Boston was a better team despite having an identical record. But the Indians’ 96 wins are worth every bit as much in baseball value terms as the Red Sox are, even if they were “easier” to obtain.
My point is that there are two issues in play when discussing quality of opposition. The first issue is that a baseline pitcher, be that baseline average, replacement, or anything else, would have a different expected level of performance based on opponent quality. But the second issue is that if a team is fortunate enough to face a weaker schedule, the wins are real, the playoff appearance that results is real, the revenue that comes from increased wins is real. So to me it is not entirely clear that it should be considered from a value perspective. This is another one of the potential adjustments that pop up in sabermetrics, and I think you need to define exactly what it is that you are trying to measure before deciding whether or not to adjust. To me, too many people have a visceral reaction and say “Oh, that’s not fair, and we can come up with a reasonable estimate as to its effect, so let’s do it”, without thinking about whether it really is the right choice given the goal.
So to me, and you are of course free to disagree, quality of opposition should only be considered within the context of one’s team. If a pitcher faced a lower quality of opposition than the rest of his team, then I would hold that against him. Suppose that Sabathia and Carmona are identical pitchers in terms of quality, but Sabathia faces an average .510 opponent and Carmona an average .500 opponent (this can be though of in terms of OW%; the W% figures are just easier to work with in this context). Sabathia will have less value when we figure RAA or RAR since we don’t account for opposition quality. But it wouldn’t have mattered one bit to the fate of the Tribe if they had flipped places, and Carmona wound up having less estimate value.
(In fact, Sabathia’s opponents hit a composite .263/.329/.409 versus .263/.334/.413 for Carmona. In terms of runs, those figures imply that Sabathia’s average opponent was equivalent to 4.63 runs per game, while Carmona’s was 4.76.)
However, if Sabathia and Beckett were of identical quality, and Sabathia faced .500 opponents while Beckett faced .510, the Indians will win real games as a result of this. Whether this is fair or not is not really my concern; it is real.
I see this great race as:
1) C.C. Sabathia, CLE
2) Josh Beckett, BOS
3) John Lackey, LAA
4) Fausto Carmona, CLE
5) Johan Santana, MIN
In the Neanderthal League, things are a lot clearer. Two candidates stand out above the pack, one of whom was my choice a year ago. He is Brandon Webb, and his rival is Jake Peavy. Behind them, the second tier of candidates includes Tim Hudson, Roy Oswalt, Brad Penny, and John Smoltz.
Comparing Webb and Peavy, Webb pitched 13 more innings, but his RA was .36 higher. They were essentially even in both eRA and FIP (+.04 advantage in eRA for Peavy, +.03 for Webb in FIP). The gap between Webb and Peavy was a 13 inning pitcher allowing a 9.48 RA. Peavy leads +44 to +37 in RAA and +73 to +68 in RAR. He also pitched a quality start 82 percent of the time versus just 65 for Webb. I see no reason at all to not side with Peavy.
The other candidates have very little to separate them; I take Oswalt and Hudson over Penny because I would sleep better at night with them in my rotation. Is that stupid, arbitrary reasoning? Heck yeah. But Penny’s maximum 2 RAA and 1 RAR edge over the lesser of those two isn’t worth much either:
1) Jake Peavy, SD
2) Brandon Webb, ARI
3) Tim Hudson, ATL
4) Roy Oswalt, HOU
5) Brad Penny, LA
Tuesday, July 31, 2007
My Top 60 Starters, 1-10
10. Eddie Plank (.594 NW%, 127 ARA, +52, +115)
9. Warren Spahn (.584, 120, +46, +119)
8. Lefty Grove (.650, 143, +66, +120)
7. Greg Maddux (.599, 131, +60, +124)
6. Tom Seaver (.611, 130, +62, +128)
5. Christy Mathewson (.635, 131, +62, +128)
4. Roger Clemens (.654, 141, +78, +145)
3. Pete Alexander (.643, 135, +78, +150)
2. Walter Johnson (.619, 141, +96, +179)
1. Cy Young (.621, 130, +93, +195)
PLANK: I believe that I have ranked Plank higher then most other rankings have, and so it deserves a bit of an explanation. The Sporting News ranked him 18th among pitchers who would be eligible for my list; Bill James ranked him 17th in career value for pitchers in 1985 and 34th in his rankings in 2001. He is 25th in Adjusted Pitching Wins as of the 2005 Palmer/Gillette Encyclopedia, and 33rd in Pitching Wins. So why is he tenth here?
Because I don’t see any reason why he shouldn’t be, at least with respect to the way I have ranked everyone else. The good justifications for dropping Plank that I can accept are based on looking at the definition of “top” in a different way or making a better attempt at isolating pitching from fielding support.
Plank’s NW-NL record is 309-211, which is good for 106 WCR. The only pitcher ranked below him on this list with more WCR is Randy Johnson. Plank can be seen as an earlier-day Spahn; a left-hander who never had the dominant seasons of some of the other greats, but was good for a long time. He had 14 seasons of >=5 WAR. Cy Young had 17, Mathewson 11, Alexander 15, Johnson 17…he was good for as long as his contemporaries were, but not as brilliant. Plank’s top 5 seasons only sum to +44 WAR, which is thirtieth among pitchers I have looked at; only Spahn ranks lower among the top ten. So he’s not going to blow anyone away on peak value, especially when you consider the era in which he pitched.
The more interesting thing on its face is why my WAA for Plank differs so much from Palmer’s. Palmer has him at +29, using earned runs CORRECTION: Greg Spira, an associate editor of the ESPN Baseball Encyclopedia, wrote to point out that Pete charges half of unearned runs to the pitcher. Shows what I get for not reading the glossary and assuming the methodology was the same as in some of his earlier works. Using earned runs instead of all runs, I get Plank down to +32. Plank allowed a smaller share of unearned runs then the league average during his time (75% of Plank’s runs were earned, 72% for the league), but that is a far cry from today when 90% of runs are earned. So I’m sure some will argue that using RA instead of ERA overvalues old-time pitchers, and there is some truth to that. But I think that using ERA is a band-aid, a poor substitute for attempting to estimate defense dependence in other ways.
GROVE: Grove suffers because of a shorter career then others, due partly to his stint in Baltimore, for which I do not credit him. You can see that in terms of WAA, he ranks fifth, and the higher baseline helps him. Either way, he’s the top southpaw of all-time in my book.
SEAVER & MATHEWSON: Bill James linked these two in the first Historical Abstract and was right on. I decided to go with Mathewson, but the fact that Seaver pitched sixty years later could make it very easy to justify him in front.
CLEMENS: Can he catch Alexander? He’s got him in rates and WAA, and he picked up four WAR last year, but that was pitching brilliantly. If he stays on the half season plan, it’ll be tough.
YOUNG: I am tempted to move Young down because of the fact that a lot of his value (97 WAR) is in the nineteenth century, and this is a post-1900 list, with the exception of guys like Young who pitched a significant amount after the turn of the century. Of course, that’s only about half of his value; you could make two top twenty pitchers out of him.
Tuesday, July 17, 2007
My Top 60 Starters, 11-20
20. Don Sutton (.543 NW%, 111 ARA, +29 WAA, +102 WAR)
19. Nolan Ryan (.530, 110, +27, +102)
18. Carl Hubbell (.600, 141, +47, +97)
17. Randy Johnson (.661, 130, +46, +99)
16. Jim Palmer (.559, 127, +46, +101)
15. Bob Gibson (.583, 127, +47, +101)
14. Phil Niekro (.552, 111, +32, +107)
13. Steve Carlton (.568, 113, +35, +107)
12. Bert Blyleven (.537, 118, +42, +111)
11. Gaylord Perry (.542, 114, +38, +112)
SUTTON & RYAN: They are very close, almost identical, in terms of value. I went with Ryan because his style certainly relied less on his defense. But it is amazing how big the disconnect in public opinion is, when in fact there is a good case to be made that they are equals. I’m not saying it’s puzzling that Ryan gets more ink, but it’s my impression that 90% of fans would be incredulous if you claimed these two belonged in the same league.
JOHNSON: Johnson could easily be ahead of Palmer, given the Ryan-type style issues, and the quality of Palmer’s teams. Perhaps with a career rejuvenation back in Arizona, he could move up…he only averaged about three WAR in two years in New York.
BLYLEVEN: I think enough has probably been written about him in the blogosphere, don’t you?
Seeing Niekro, Blyleven, and Perry ahead of Hubbell, Gibson, and Palmer may seem strange to a lot of people, but it again is a consequence of looking at career value above replacement. I’m running out of comments to make, because everybody already knows about these guys, and rating them highly doesn’t need any justification. We are also starting to get into the area where there are big gaps in WAR that make it tougher for me to just stick one pitcher in front of another because I feel like it.
Tuesday, July 10, 2007
My Top 60 Starters, 21-30
30. Mike Mussina (.622 NW%, 126 ARA, +37 WAA, +82 WAR)
29. Curt Schilling (.606, 130, +40, +83)
28. Ed Walsh (.602, 137, +44, +86)
27. Miner Brown (.605, 131, +44, +88)
26. Tom Glavine (.583, 119, +35, +93)
25. Whitey Ford (.646, 131, +42, +86)
24. Bob Feller (.601, 122, +38, +91)
23. Pedro Martinez (.680, 157, +53, +89)
22. Robin Roberts (.551, 114, +32, +97)
21. Fergie Jenkins (.557, 117, +36, +98)
MUSSINA: As we start hitting active pitchers, we have to be careful about jumping the gun, although as I’ve mentioned previously, the low baseline used here makes it hard for pitchers to lose too much ground.
SCHILLING: I’ve never been a particular fan of Schilling, but he’s got the credentials to be here. He’s always struck me as a self promoter (bloody sock), crybaby (Ben Davis’ bunt to breakup the perfect game), or a combination thereof (taking a bat to the Questec camera). But the man can pitch, and as MHS would want me to point out, his playoff performances have been unreal.
FORD & BROWN: These two are a pretty good match, stats-wise. They each pitched for dominant teams, and then all of their major measures match up pretty well, except the Chairman’s W-L record is more impressive. I give Ford a boost for pitching 146 World Series innings with a 2.71 ERA (although he was “only” 10-8), but Brown himself did some solid work in October (5-4).
FELLER: He is low here compared to other lists, because he is the great pitcher most hurt by my refusal to give WWII credit. If you conservatively give him sixteen more WAR, he’s in the top fifteen, at least.
MARTINEZ: There is no pitcher in history with a better ARA or NW%, although if he does pitch some more, he’ll likely decline in those categories (whether his standing on the all-time lists will decline is another matter). Some will claim that he is not durable enough, but his +89 WAR puts him in this class. I put him ahead of Glavine and Feller because of the (very slight) peak/WAA consideration (he is eighth all time in WAA, with only the top eight pitchers on my list ranking ahead of him), but it’s possible that he’ll work his way over them (and others) in WAR on his own. Or he could be almost done. Either way, he’s one of the greats.
ROBERTS & JENKINS: Bill James has written a few times about how they are a pretty good match for each other stylistically, and in the end, they had nearly equivalent value. They tower above the other pitcher that James put in that group (Catfish Hunter).
Tuesday, July 03, 2007
My Top 60 Starters, 31-40
40. Kevin Brown (.589 NW%, 122 ARA, +33 WAA, +78 WAR)
39. Stan Coveleski (.574, 126, +35, +78)
38. Juan Marichal (.614, 118, +30, +79)
37. Tommy John (.545, 107, +18, +83)
36. Ted Lyons (.559, 112, +25, +82)
35. John Smoltz (.557, 127, +36, +80)
34. Eppa Rixey (.514, 111, +22, +85)
33. Vic Willis (.529, 114, +26, +82)
32. Red Ruffing (.522, 111, +23, +83)
31. Red Faber (.552, 114, +27, +84)
BROWN: I don’t have any insight on this, but I assume he’ll be snubbed by the Hall voters, for a number of reasons. First, he’s not well-liked, by anybody. Second, he never got the credit he was due when he was pitching, at least I never thought that he did. Third, he is the least-impressive of a barrage of great pitchers who will hit the ballot within a few years of his doing so (Smoltz, Glavine, Maddux, Clemens, Johnson, Schilling), with Mussina and Pedro probably not that far behind. I think they are all worthy of the Hall, but I think Brown may have to wait until he’s long gone and the numbers speak louder then the other factors.
MARCICHAL: I was surprised to see the Dominican Dandy so low; he certainly does better in the W-L measures then he does in runs allowed. Bill James originally rated him in front of Gibson, but came around in the second edition of the Historical Abstract. Still a unique pitcher and one I would have loved to have watched.
JOHN: The first of two eligible pitchers on the ballot but not in the Hall. John is a career value special, as nobody that follows has less then 20 WAA. John recently agitated that he should be in Cooperstown, and while I agree, he can take comfort in knowing that barring some new advance in sports medicine, his name will remain in the forefront longer then a lot of pitchers who were better then he was.
SMOLTZ: He gets no extra credit here for the higher leverage innings in his three years of closing, either; of course, I also compared those innings to the lower replacement level for starters (.390), so things even out a bit.
WILLIS: Willis, a fairly recent Veterans’ Committee pick, is often put down as a bad one but I just don’t see it. His win-loss isn’t very impressive, but +63 WCR isn’t horrible. But he does well in run-based metrics, and he had three 10 WAR seasons, more then contemporaries like Plank and McGinnity. I see this moer as a wrong righted then a grievous blow to the sanctity of the Hall of Fame.
Tuesday, June 26, 2007
My Top 60 Starters, 41-50
50. Jack Powell (.508 NW%, 106 ARA, +14 WAA, +75 WAR)
49. Rube Waddell (.561, 125, +32, +74)
48. Dazzy Vance (.596, 125, +32, +74)
47. Don Drysdale (.535, 118, +29, +77)
46. Gus Wynn (.531, 106, +13, +77)
45. Luis Tiant (.559, 117, +29, +78)
44. Joe McGinnity (.603, 119, +29, +77)
43. Hal Newhouser (.565, 125, +35, +76)
42. Jim Bunning (.547, 115, +27, +79)
41. Billy Pierce (.534, 121, +32, +78)
POWELL: His career record was 245-256, but he pitched for bad (.462 Mate) teams. His neutralized record of 255-246 is good for +59 WCR, but he does much better in a run-based analysis, coming at +75. He has no peak to speak of, especially for a pitcher of his time, but has a lot of value against a low baseline over the course of almost 4400 innings.
WADDELL & VANCE: As you can see, these two are almost a perfect match, except Vance’s W-L record is more impressive and he was sane (and right-handed). They were both strikeout pitchers, but have wildly different career paths. Waddell was done by age 33 and dead by 36. Vance had cups of coffee at ages 24 and 27, but didn’t establish himself until age 31. In the end, the shooting star and the late bloomer had pretty much equal value.
DRYSDALE: I know that I will catch flak, if anyone cares, for putting Drysdale ahead of Koufax. But from a career comparison against a replacement baseline, it is tough to avoid, as Drysdale has twelve more WAR and is only four behind in WAA. There is absolutely no question that Koufax was the Dodgers’ ace, but four or five years don’t override the career. Neither lasted much past thirty, but Drysdale pitched 1000 more innings.
WYNN: The lowest-ranking 300 game winner, and perhaps sliding him past Drysdale was inappropriate, but certainly a fine pitcher.
NEWHOUSER: Some people take away credit because two of his best seasons came during the war. 1945 was his best, but actually 1946 was a little better then 1944. Anyway, the principle here is that a major league win is worth the same no matter what. Top five years of +49.8 WAR is a dead ringer for Koufax. In fact, he had a six year string from 1944-49 of 10.7, 12.8, 11, 7.5, 7.5, 7.8.
PIERCE: Pierce is the highest ranking pitcher on my list not in the Hall of Fame who is either 1) eligible or 2) not through to the Vets Committee yet. There are two eligible pitchers ahead of him who have not yet been inducted, but they are both still on the main ballot.
Tuesday, June 12, 2007
My Top 60 Starters, 51-60
Here is the first group of 10:
60. Dave Stieb (.561 NW%, 120 ARA, +28 WAA, +68 WAR)
59. Jack Quinn (.526, 109, +18, +73)
58. Addie Joss (.616, 133, +33, +65)
57. Sandy Koufax (.633, 130, +33, +65)
56. Tommy Bridges (.570, 122, +29, +68)
55. Urban Shocker (.609, 126, +31, +68)
54. Waite Hoyt (.531, 111, +22, +74)
53. Rick Reuschel (.547, 114, +23, +73)
52. Wilbur Cooper (.551, 115, +25, +73)
51. Babe Adams (.567, 121, +29, +71)
I’m not going to discuss each pitcher, but will comment on some.
STIEB: He’s not a guy that you think of as one of the greats, but he had one of the best peaks of roughly cotemporary pitchers (Gooden, Saberhagen, Cone). Again, in this area of the rankings there is not a lot of distinction between the pitchers, so being #60, there are a lot of others you can make a case for.
QUINN: Jack Quinn might be the least known pitcher with 247 wins. Adjusting to his teams, his neutral record is 244-221. His runs allowed stats look similar, so he’s a guy who doesn’t do that great against average but could be ranked several spots higher if you focus on WAR. He only had one 20 win season, with the Baltimore Feds in 1914, and bounced around, with two main stints with the Yankees and one with the Red Sox and the A’s.
JOSS & KOUFAX: Many people will be stunned to see Koufax so low, but by career value, you have to start raising the baseline from replacement in order to even get him on the list. Koufax and Joss do have the highest WAA for any pitchers in this group, and were certainly brilliant. Koufax had better W-L records, but they are almost dead ringers in the other categories. The reason I’ve put Koufax ahead is that he was pitching fifty years later.
However, Koufax’s peak value is perhaps not as astronomical as some believe it to be, depending on how it is defined. His best five seasons by WAA are 1962-66, by WAR 1961 and 1963-66. Only four of those were truly brilliant, those being 63-66. His WAR over his top five seasons was +50, fifteenth best of the pitchers I’ve looked at, but within two and a half wins are Carlton, Maddux, and Clemens, while Gibson and Seaver both rank slightly higher then him. The difference is that the others did not string their peaks together as Koufax did.
So if your definition of peak is “top 3 or 4 consecutive seasons”, then Koufax is the greatest modern peak pitcher. But if you use other definitions, he’s just one of the best. This is a great example of the issues I have with peak value.
REUSCHEL: Another modern pitcher who nobody expects to see here, but the guy was good. He’s probably underrated by traditionalists because they don’t account for the fact that he pitched in Wrigley Field from 1972-81 when the PF was hovering around 1.08. For his career, he pitched in a 1.05 PF park on average. His peak is nothing to write home about, but that doesn’t count for much here. I believe Bill James had him around eightieth.
Sunday, May 27, 2007
My Top 60 Starters, Warmup
In the next installment I will get around to unveiling (a nice word to build suspense and anticipation where none should exist) spots 51-60 on my list; for now, I am going to discuss some of the pitchers who did not make the list and how the average and median Hall of Famer does.
Here are the figures for the average and median Hall of Famers:
CAT….NW%...WAT.…….WCR…...ARA……..WAA………....WAR………......Top 5
AVG….578…….33.9……...83.2……120……….35.3………...90.1………..45.6
MED….575…….29.2……..78.1…….116……….32.1………..83.2………..44.3
To me, anyone who is better then the median Hall of Famer should probably be there himself, no questions asked (all other things being equal). It is those below the median for whom there is a real debate. There are 31 pitchers with more career WAR then the median Hall of Famer, and all who are eligible are in the Hall with the exception of Bert Blyleven.
Now, let me tell you that pitchers 61-73 on my list, in rough chronological order are: Sam Leever, Ed Reulbach, Chief Bender, Carl Mays, Bob Shawkey, Dolf Luque, Burleigh Grimes, Herb Pennock, Bucky Walters, Jerry Koosman, Jim Kaat, Bret Saberhagen, and David Cone. To be honest, by the time I got to around 45 it was very difficult to make judgments on specific pitcher-to-pitcher comparisons; there are too many guys with similar WAR, similar WAA, similar ARA, etc.
Among pitchers who didn’t make it at all, there are few that I will discuss. The first is Eddie Cicotte. The numbers alone would have ranked Cicotte in the mid-40s, but I docked him the entire 1919 season, which was his second-best season, +11.8 WAR. That drops him from the mid-40s into the range of borderline top sixty, and I chose other pitchers ahead of him. If you throw the World Series, then you have in my eyes destroyed your body of work in the regular season. Add in the fact that his fourth-best season, 1920 (+7.6 WAR), has to be viewed with some suspicion given the fact that he had already knowingly thrown games at the time, and it’s easy to drop him past the very similar numbers of others in that group. On talent alone, Cicotte would belong.
Jack Morris is a pitcher whose reputation is just not matched by his performance. The reason he has been overrated is that he does well in W-L record; his +74 WCR ranks thirty-eighth all-time. But his career ARA was just 105; he was only +63 WAR for his career. He COULD be ranked in the top sixty, particularly if you want to give more weight to the W-L, but I can’t justify it myself.
Mel Harder is a guy who still gets Hall of Fame push, but maybe that is only my impression because I am from Cleveland and read old newspaper columnists wax poetic about the olden days of good old Mel. After all, the famous Bill James Keltner List was the result of old Keltner fans pushing him, and was discussed in the Indians essay of one of a Abstract. Mel Harder was a fine pitcher, no doubt; .534 NW%, 108 ARA, +58 WCR, +61 WAR. But what sets him apart from Milt Pappas (.550, 111, +60, +61)? Or Freddie Fitzsimmons (.572, 109, +66, +59)? Or Orel Hershiser (.567, 109, +63, +59)? You get the idea. There are too many pitchers with near identical characteristics. These are the guys who would make up the bottom portion of the Top 100. Excellent pitchers, not Hall of Famers.
Well, that is, except for the Hall of Famers who don’t make my top sixty. Leaving out Bender and Grimes, who were in my 61-70 range, they are: Lefty Gomez, Catfish Hunter, Bob Lemon, Jesse Haines, Jack Chesbro, Dizzy Dean, and Rube Marquard.
Gomez pitched for great Yankees teams, and ranks much better versus average then he does against replacement. Jimmy Key has very similar numbers, though, with the exception of Gomez’ higher peak. Nobody thinks of Key as an all-time great.
The late Catfish was by all accounts a great guy, and he pitched for six pennant winners. But his career was short, and if you compare him carefully to his teammate Vida Blue, it’s tough to pick one. Blue is viewed as a disappointment because of his brilliant early work, followed by fairly average pitching, but:
NAME……………..NW%....................ARA……………WAA………..WCR……….WAR
Hunter……………..558……………….107……………...+14…………+66………….+62
Blue………………..555……………….108……………...+16…………+61………….+62
Hunter did that in 3449 IP, Blue in 3343.
Bob Lemon had a short career (2850 IP). His teams had excellent records (.589, about the same as the .587 for Whitey Ford). He was a converted third baseman, so he wasn’t a bad hitter, but +61 WAR needs a lot of help to get into HOF territory. He could get some war credit, but he missed his age 22-24 seasons and was not a pitcher before he left, so that’s extremely iffy to me.
Jesse Haines was one of the Frankie Frisch crony choices, and has absolutely nothing to set him apart from the pitchers in the Mel Harder pack, as he was .549, 108, +59, +58 himself.
Jack Chesbro is probably in the HOF because of his tremendous 41-12 season in 1904. That was a legitamitely great season (+14.8 WAR), but he never again cracked double digits, so his peak is not THAT spectacular (+45 WAR in top 5 years ranks thirtieth). But if you focus on peak value, he has a case to be one of the greats.
Dizzy Dean was brilliant as well, but only for a brief time. His top 5 seasons are +42, good enough to rank 39th, so he’s a peak special. His rate stats are great (.625 NW%, 131 ARA), but he was 33 innings short of 2000. Just not enough career value for me.
Finally, Rube Marquard’s inclusion in the Hall of Fame is a joke. Marquard was slightly above average on a rate basis (.517 NW%, 104 ARA), and didn’t have a super-long career in order to provide that much value (+53 WAR). Compare him to Claude Passeau, who I doubt many have even heard of (.512 NW%, 110 ARA, +52 WAR). Marquard is, without any doubt in my mind, the worst pitcher in the Hall of Fame. He wouldn’t make my top 120.
Then there are the pitchers who are included in the Hall of Merit but not in my top sixty. These I will treat in more detail then the HOF snubs, because I think the HOM voters are much more qualified to do this task, and since there are not the personal politics of the Frisch-type that got us Jesse Haines.
Alright, I lied, there’s no “pitchers”. There’s a pitcher, singular, and that is Wes Ferrell. Let me start by giving you my evaluation of Ferrell, and then let’s look into arguments put forward in his favor. Luckily, Dick Thompson does not read my blog or know me from Adam, so we can do this rationally.
Ferrell has a great W-L record, there’s no doubt about it: .607 NW%, +35 WAT, +70 WCR (45th in WCR). However, his ARA is only 112, for +15 WAA and +52 WAR. He pitched only 2630 innings, and won just 18 games after the age of 30.
One pro-Ferrell point is that he had a fine peak, which is true, but given the ground rules here, is irrelevant. Another is that he was an excellent hitter. This we can quantify, so let’s get at it. Ferrell 1305 career PA, hitting 280/351/446. This is excellent, but not quite as good as it looks, as he played in a high-scoring context (N=5.22, PF=1.02). His RG of 5.60 is +13 runs versus an average hitter.
Of course, the standard should not be an average hitter, but an average hitting pitcher. The average pitcher hit at 40% of the league RG in the 1930s (a .138 OW%). Ferrell is +118 runs against this standard.
But in fact this is too much, because Ferrell should only be compared to a pitcher when he is actually pitching. Ferrell played in a total of 547 major league games, but only 373 of these were as a pitcher. That means that in 174 of those games, he needs to be compared to a replacement level hitter, not an average pitcher.
Unfortunately, we don’t know how many PA he had in those games, but let’s be conservative and assume it was just one per game. Sure, there may have been games in which he pinch ran or something and never hit, but there were also likely games in which he had multiple PAs. Ferrell played in 13 games in the outfield for the Indians in 1933, his only games in the field, and recorded 2.46 Total Chances/Game, versus a league average of 2.28, so it’s safe to say he was playing the majority of those games.
So we assume that Ferrell had 1131 PAs that need to be evaluated v. an average pitcher, and 174 that need to be evaluated v. a replacement hitter (73% of the league average, .350 OW%). Under this new standard, he is +110 runs, which translates to +10.5 wins.
These are extra wins that we can add in to his pitching performance, and so instead of being +52 WAR and +15 WAA, he can be +64 WAR and +26 WAA. This would definitely bring him closer to the top 60, however there are twelve pitchers with the higher or same WAR not in, and many others right behind them. The WAA fares better; there are only six in the neighborhood. So perhaps I should have put Ferrell in the 61-70 range, but he still doesn’t crack the top sixty.
Some of the other arguments for Ferrell centered around peak value by comparing him to Grove, which is not something I’m going to explore here because peak is not on the table at all. Another was that Ferrell had to pitch more against the better teams in the league because he was his team’s ace, and a poor team needed to throw their big gun to have a shot against the Yankees and the other contenders.
“Jonesy” provided in-depth data that he researched for 1932, which I rate as Ferrell’s fourth-best season (+6.8 WAR). Here are Ferrell’s IP v. each team, along with their RG:
NY: 42.1 IP, 6.42 RG
PHA: 41 IP, 6.37 RG
WAS: 44 IP, 5.45 RG
DET: 47.1 IP, 5.22 RG
SLA: 33 IP, 4.77 RG
CHA: 52.1 IP, 4.39 RG
BOS: 27.1 IP, 3.68 RG
Weighting each team’s RG by the percentage of his IP thrown against them, the true context Ferrell pitched against was 5.25 runs/game. The assumed context was 5.33 r/g, so this in fact hurts Ferrell, ever so slightly. The point of this data was supposed to be a comparison with Grove, but that is irrelevant here; the conclusion is that in 1932, at least, Ferrell’s assumed and actual contexts were essentially equal, and no adjustment is needed.
I don’t know if other data was compiled broken down by season, but if so I have not found it. The bottom line is that Ferrell is a borderline top 70 pitcher by my standards. He is not a HOFer by these standards.