For the last several years I have published a set of team ratings that I call "Crude Team Ratings". The name was chosen to reflect the nature of the ratings--they have a number of limitations, of which I documented several when I introduced the methodology.
I explain how CTR is figured in the linked post, but in short:
1) Start with a win ratio figure for each team. It could be actual win ratio, or an estimated win ratio.
2) Figure the average win ratio of the team’s opponents.
3) Adjust for strength of schedule, resulting in a new set of ratings.
4) Begin the process again. Repeat until the ratings stabilize.
The resulting rating, CTR, is an adjusted win/loss ratio rescaled so that the majors’ arithmetic average is 100. The ratings can be used to directly estimate W% against a given opponent (without home field advantage for either side); a team with a CTR of 120 should win 60% of games against a team with a CTR of 80 (120/(120 + 80)).
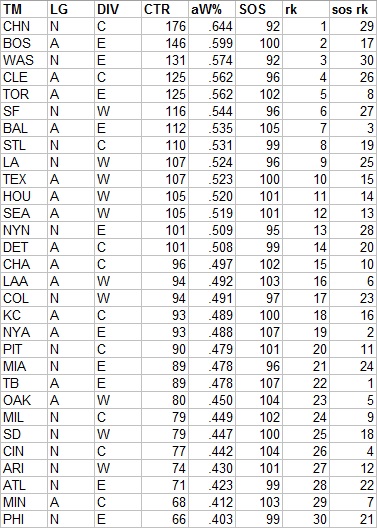
First, CTR based on actual wins and losses. In the table, “aW%” is the winning percentage equivalent implied by the CTR and “SOS” is the measure of strength of schedule--the average CTR of a team’s opponents. The rank columns provide each team’s rank in CTR and SOS:

Last year, the top ten teams in CTR were the playoff participants. That was not remotely the case this year thanks to a resurgent gap in league strength. While the top five teams in the AL made the playoffs and the NL was very close, St. Louis slipping just ahead of New York and San Francisco (by a margin of .7 wins if you compare aW%), the Giants ranked only fifteenth in the majors in CTR. Any of the Mariners, Tigers, Yankees, or Astros were considered stronger than the actual NL #3 seed and CTR finisher the Dodgers.
The Dodgers had the second-softest schedule in MLB, ahead of only the Cubs. (The natural tendency is for strong teams in weak divisions to have the lowest SOS, since they don’t play themselves. The flip is also true--I was quite sure without checking to verify that Tampa Bay had the toughest schedule). The Dodgers average opponent was about as good as the Pirates or the Marlins; the Mariners average opponent was rated stronger than the Cardinals.
At this point you probably want to see just how big of a gap there was between the AL and NL in average rating. Originally I gave the arithmetic average CTR for each divison, but that’s mathematically wrong--you can’t average ratios like that. Then I switched to geometric averages, but really what I should have done all along is just give the arithemetic average aW% for each division/league. aW% converts CTR back to an “equivalent” W-L record, such that the average across the major leagues will be .50000. I do this by taking CTR/(100 + CTR) for each team, then applying a small fudge factor to force the average to .500. In order to maintain some basis for comparison to prior years, I’ve provided the geometric average CTR alongside the arithmetric average aW%, and the equivalent CTR by solving for CTR in the equation:
aW% = CTR/(100 + CTR)*F, where F is the fudge factor (it was 1.0012 for 2016 lest you be concerned there is a massive behind-the-scenes adjustment taking place).

Every AL division was better than every AL division, a contrast from 2015 in which the two worst divisions were the NL East and West, but the NL Central was the best division. Whether you use the geometric or backdoor-arithmetric average CTRs to calculate it, the average AL team’s expected W% versus an average NL team is .545. The easiest SOS in the AL was the Indians, as to be expected as the strongest team in the weakest division; it was still one point higher than that of the toughest NL schedule (the Reds, the weakest team in the strongest division).
I also figure CTRs based on various alternate W% estimates. The first is based on game-Expected W%, which you can read about here. It uses each team’s game-by-game distribution of runs scored and allowed, but treats the two as independent:
Next is Expected W%, that is to say Pythagenpat based on actual runs scored and allowed:

Finally, CTR based on Predicted W% (Pythagenpat based on runs created and allowed, actually Base Runs):

A few seasons ago I started including a CTR version based on actual wins and losses, but including the postseason. I am not crazy about this set of ratings, but I can’t quite articulate why.
On the one hand, adding in the playoffs is a no-brainer. The extra games are additional datapoints regarding team quality. If we have confidence in the rating system (and I won’t hold it against you if you don’t), then the unbalanced nature of the schedule for these additional games shouldn’t be too much of a concern. Yes, you’re playing stronger opponents, but the system understands that and will reward you (or at least not penalize you) for it.
On the other hand, there is a natural tendency among people who analyze baseball statistics to throw out the postseason, due to concerns about unequal opportunity (since most of the league doesn’t participant) and due to historical precedent. Unequal opportunity is a legitimate concern when evaluating individuals--particularly for counting or pseudo-counting metrics like those that use a replacement level baseline--but much less of a concern with teams. Even though the playoff participants may not be the ten most deserving teams by a strict, metric-based definition of “deserving”, there’s no question that teams are largely responsible for their own postseason fate to a much, much greater extent than any individual player is. And the argument from tradition is fine if the issue at hand is the record for team wins or individual home runs or the like, but not particularly applicable when we are simply using the games that have been played as datapoints by which to gauge team quality.
Additionally, the fact that playoff series are not played to their conclusion could be seen as introducing bias. If the Red Sox get swept by the Indians, they not only get three losses added to their ledger, they lose the opportunity to offset that damage. The number of games that are added to a team’s record, even within a playoff round, is directly related to their performance in the very small sample of games.
Suppose that after every month of the regular season, the bottom four teams in the league-wide standings were dropped from the schedule. So after April, the 7-17 Twins record is frozen in place. Do you think this would improve our estimates of team strength? And I don’t just mean from the smaller sample, obviously their record as used in the ratings could be more heavily regressed than teams that played more games. But it would freeze our on-field observations of the Twins, and the overall effect would be to make the dropped teams look worse than their “true” strength.
I doubt that poorly reasoned argument swayed even one person, so the ratings including playoff performance are:

The teams sorted by difference between playoff CTR (pCTR) and regular season CTR (rsCTR):

It’s not uncommon for the pennant winners to be the big gainers, but the Cubs and Indians made a lot of hay this year, as the Cubs managed to pull every other team in the NL Central up one point in the ratings. The Rangers did the reverse with the AL West by getting swept out of the proceedings. They still had a better ranking than the team that knocked them out, as did Washington.
Monday, January 23, 2017
Crude Team Ratings, 2016
Subscribe to:
Post Comments (Atom)
No comments:
Post a Comment
I reserve the right to reject any comment for any reason.