Of all the annual repeat posts I write, this is the one which most interests me--I have always been fascinated by patterns of offensive production by fielding position, particularly trends over baseball history and cases in which teams have unusual distributions of offense by position. I also contend that offensive positional adjustments, when carefully crafted and appropriately applied, remain a viable and somewhat more objective competitor to the defensive positional adjustments often in use, although this post does not really address those broad philosophical questions.
The first obvious thing to look at is the positional totals for 2015, with the data coming from Baseball-Reference.com. "MLB” is the overall total for MLB, which is not the same as the sum of all the positions here, as pinch-hitters and runners are not included in those. “POS” is the MLB totals minus the pitcher totals, yielding the composite performance by non-pitchers. “PADJ” is the position adjustment, which is the position RG divided by the overall major league average (this is a departure from past posts; I’ll discuss this a little at the end). “LPADJ” is the long-term positional adjustment that I use, based on 2002-2011 data. The rows “79” and “3D” are the combined corner outfield and 1B/DH totals, respectively:

The mid-defensive spectrum positions, third base and center field, both had big years, exceeding the production of left field and coming close to matching combined corner outfield production. It was also a good year for DHs. Pitchers rebounded from their first ever negative RG performance to post a PADJ of 2, better than 2012 or 2014. In 2014 pitchers hit .122/.154/.152, so their .132/.160/.170 performance saw upticks in both BA (+.010) and ISO (+.008).
In examining team performance, let’s start with the least important, the performance of NL pitchers. I need to stress that the runs created method I’m using here does not take into account sacrifices, which usually is not a big deal but can be significant for pitchers. Note that all team figures from this point forward in the post are park-adjusted. The RAA figures for each position are baselined against the overall major league average RG for the position, except for left field and right field which are pooled.

As usual, the spread from best unit to worst is around twenty runs.
I don’t run a full chart of the leading positions since you will very easily be able to go down the list and identify the individual primarily responsible for the team’s performance and you won’t be shocked by any of them, but the teams with the highest RAA at each spot were:
C--OAK, 1B--ARI, 2B--HOU, 3B--TOR, SS--HOU, LF--STL, CF--LAA, RF--WAS, DH--TOR
More interesting are the worst performing positions; the player listed is the one who started the most games at that position for the team:

This list is AL-dominated, with center field the only position where a NL team was last. But the main point of interest here is the futility of the Seattle catchers. They only slightly outperformed San Francisco’s pitchers, and that’s not hyperbole. Giant pitchers hit .169/.189/.294 for 1.39 RG; Mariner catchers hit .165/.214/.269 for 1.44 RG. Mike Zunino was the bright spot, hitting .181/.238/.311 for 2.13 RG in 375 PA as a catcher. The rest of the catchers combined to hit .136/.168/.191 for .24 RG in 197 PA. That RG would have ranked just fifth-best among NL pitching staffs, and was most comparable to the Dodgers (.127/.167/.175 for .20 RG). And every one of them was worse than Zunino (Jesus Sucre 1.02 RG in 133 PA, Welington Castillo -.54 RG in 22, John Hicks -1.08 RG in 31, Steven Baron -2.55 RG in 11).
This chart also makes it apparent why Brett Lawrie was of interest to Chicago, as both of his potential positions were the worst in the majors offensively (I wrote that prior to Todd Frazier also being acquired which means that both gaping holes have been addressed).
I like to attempt to measure each team’s offensive profile by position relative to a typical profile. I’ve found it frustrating as a fan when my team’s offensive production has come disproportionately from “defensive” positions rather than offensive positions (“Why can’t we just find a corner outfielder who can hit?”) The best way I’ve yet been able to come up with to measure this is to look at the correlation between RG at each position and the long-term positional adjustment. A positive correlation indicates a “traditional” distribution of offense by position--more production from the positions on the right side of the defensive spectrum. (To calculate this, I use the long-term positional adjustments that pool 1B/DH as well as LF/RF, and because of the DH I split it out by league):

In a typical seasons there are more teams with negative correlations than this, and Milwaukee’s +.90 r is about as high as you’ll ever see. But that was not a good thing as only their corner outfield spots were above average for their positions. As an Indian fan, it is quite common to see them near the bottom of the list thanks to their now decade-long struggle to put quality bats at the corners (and their success with players such as Grady Sizemore, Jason Kipnis, Carlos Santana, Yan Gomes, and now Francisco Lindor contributing offensively from up-the-middle positions). As a fan it can be frustrating to see a low correlation team and think that if they could just find decent offense at those spots that the offense would be great, but on the whole it’s a curiosity and of course the team’s composite offensive ability is what matters.
The following charts, broken out by division, display RAA for each position, with teams sorted by the sum of positional RAA. Positions with negative RAA are in red, and positions that are +/-20 RAA are bolded:

Toronto had the AL’s best production from corner infielders and infielders as a unit thanks to Josh Donaldson. The bolding illustrates that it was their big three that made this a special offense. Boston had the AL’s worst corner infielders, but I was initially puzzled by Baltimore’s poor showing at DH and not-great 7 RAA at first base despite the presence of Chris Davis. Davis did his best hitting at first base (965 OPS in 454 PA) and actually had more PA as a right fielder than a DH (122 to 94). The other Oriole first basemen, though, combined to hit just .200/.244/.385 over 217 PA. Note that the Yankees got average production at shortstop after having the worst hitting shortstop(s) in the majors in 2014, some guy whose name I can’t recall.

Minnesota had the AL’s worst outfield production, while Chicago’s infield was the worst in baseball (as noted above their second and third basemen were the worst, the latter just edging out Cleveland). I don’t have the energy to write the obvious about Kansas City’s offense, which was average despite good October fortune. Sometimes baseball is dumb.
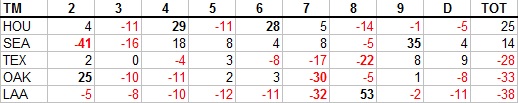
Houston had the best middle infield production in MLB. I never would have guessed that Seattle was above-average offensively; park illusions and narratives remain powerful things. Nelson Cruz allowed their outfield to lead the AL in RAA, and yet the three outfielders (+37) did not completely offset the horrid catchers (-41). The only team in the majors other than Los Angeles to have just one above-average position was the White Sox; that it was the second-best position in the majors must make Mike Trout really angry sometimes.

Washington had the majors’ most productive outfield thanks to Bryce Harper’s amazing season. Miami had the worst corner infielders in the NL. Remember that these figures are against the major league average, so the Mets aren’t being compared to a lower baseline than the Royals--their position players were better offensively relative to their positions.

The Cubs and Reds tied for the most productive corner infields in MLB, doing it in opposite ways, Chicago with near perfect balance and Cincinnati with a big season from Joey Votto and solid production from Todd Frazier. But the Reds gave it all back with the majors’ worst outfield, led by their center field disaster which they compounded by leading off their center fielders in 75 games (shortstop 66, left field 12, second base 7, right field 2).

As mentioned above, the Angels were below average at eight of nine spots; uptown the Dodgers were the only team without a below average position. Solidly above average everywhere with only one standout position led to the second highest composite RAA in the majors. Their archrivals were right behind with just two less RAA and one below average position, but three positions were standouts and they led the majors in infield RAA and the NL in middle infield RAA. Arizona had the worst middle infield RAA in the majors.
The full spreadsheet is available here.
Tuesday, January 12, 2016
Hitting by Position, 2015
Monday, January 04, 2016
Hitting by Lineup Position, 2015
I devoted a whole post to leadoff hitters, whether justified or not, so it's only fair to have a post about hitting by batting order position in general. I certainly consider this piece to be more trivia than sabermetrics, since there’s no analytic content.
The data in this post was taken from Baseball-Reference. The figures are park-adjusted. RC is ERP, including SB and CS, as used in my end of season stat posts. The weights used are constant across lineup positions; there was no attempt to apply specific weights to each position, although they are out there and would certainly make this a little bit more interesting:

For the seventh consecutive season, NL #3 hitters are the best position in baseball. It is interesting to note that the NL is superior at the majority of the lineup spots (1, 2, 3, 5, 7), yet the AL holds a slight advantage in RG from spots 1-8 combined (4.49 to 4.45). #2 hitters outperformed #5 hitters in both leagues, although the #5 spots remain home to a higher ISO than #2. Last year AL #6 hitters were quite poor (better than only three other spots); that was just a blip and the AL #6 hitters were easily the best of the eight 6-9 spots in 2015.
Next are the team leaders and trailers in RG at each lineup position. The player listed is the one who appeared in the most games in that spot (which can be misleading, especially for spots low in the batting order where many players cycle through):


The Cubs #8 and #9 spots mess up both the leaders and trailers list for the NL as the former trail thanks to Joe Maddon’s singular devotion to batting the pitcher eighth, which he did for almost every game the Cubs played in a NL park. Last year I noted in this spot that you could see why Seattle wanted Nelson Cruz as they had the AL’s worst cleanup production; Cruz turned that completely around in 2015. As I write this, a Brandon Phillips trade to Washington appears to be in the works and the MLBN commentators are seriously discussing the possibility that Dusty could lead him off. And how sad to see lineup spots led by Joe Mauer, Albert Pujols, and Ryan Howard on the trailers list (ok, the first two are sad, the latter is hilarious).
The next list is the ten best positions in terms of runs above average relative to average for their particular league spot (so AL leadoff spots are compared to the AL average leadoff performance, etc.):

And the ten worst:

I’ve run this report since 2009; -53 is surpassed only by last year’s TEX #3 hitters (for the record, they were +6 in 2015). Again, though, this is essentially comparing a full-time pitcher spot in the order to NL #8 hitters, which include only a smattering of pitchers, so it’s a misleading number (except to the extent that Joe Maddon did punt on his #8 lineup spot).
The last set of charts show each team’s RG rank within their league at each lineup spot. The top three are bolded and the bottom three displayed in red to provide quick visual identification of excellent and poor production:


The full spreadsheet is available here.
Monday, December 21, 2015
Leadoff Hitters, 2015
I will try to make this as clear as possible: the statistics are based on the players that hit in the #1 slot in the batting order, whether they were actually leading off an inning or not. It includes the performance of all players who batted in that spot, including substitutes like pinch-hitters.
Listed in parentheses after a team are all players that started in twenty or more games in the leadoff slot--while you may see a listing like "COL (Blackmon)” this does not mean that the statistic is only based solely on Blackmon's performance; it is the total of all Colorado batters in the #1 spot, of which Blackmon was the only one to start in that spot in twenty or more games. I will list the top and bottom three teams in each category (plus the top/bottom team from each league if they don't make the ML top/bottom three); complete data is available in a spreadsheet linked at the end of the article. There are also no park factors applied anywhere in this article.
That's as clear as I can make it, and I hope it will suffice. I always feel obligated to point out that as a sabermetrician, I think that the importance of the batting order is often overstated, and that the best leadoff hitters would generally be the best cleanup hitters, the best #9 hitters, etc. However, since the leadoff spot gets a lot of attention, and teams pay particular attention to the spot, it is instructive to look at how each team fared there.
The conventional wisdom is that the primary job of the leadoff hitter is to get on base, and most simply, score runs. It should go without saying on this blog that runs scored are heavily dependent on the performance of one’s teammates, but when writing on the internet it’s usually best to assume nothing. So let's start by looking at runs scored per 25.5 outs (AB - H + CS):
1. BOS (Betts/Pedroia), 5.7
2. CHN (Fowler), 5.6
3. STL (Carpenter/Wong), 5.5
Leadoff average, 4.9
28. TB (Guyer/Kiermeier/Jaso), 4.4
ML average, 4.2
29. ATL (Peterson/Markakis), 4.0
30. SEA (Marte/Jackson/Morrison), 3.8
The Rays are the team that stands out here, below average despite a healthy .339 OBA. Otherwise the leaders were above average in OBA and the trailers below average, although they weren’t extreme:
1. CLE (Kipnis), .368
2. HOU (Altuve/Springer), .367
3. CHA (Eaton), .356
4. SF (Aoki/Pagan/Blanco), .353
Leadoff average, .329
ML average, .319
28. KC (Escobar), .297
29. CIN (Phillips/Hamilton/Bourgeois), .291
30. LAA (Aybar/Calhoun/Giavotella), .282
I did include HB in OBA this year, so it is (H + W + HB)/(AB + W + HB).
I recently heard some on MLB Network saying that a key for the White Sox would be Adam Eaton getting back to form. But the Eaton-led Chicago leadoff men were quite solid. They even posted a .138 ISO which was one point better than the average for leadoff hitters, so I’m not sure where the notion that Eaton was the problem with the Chicago offense came from.
Escy-magic alright. But if it magically works for a handful of playoff games, by all means, let’s start a trend towards hacking low OBA leadoff hitters. Maybe the Angels will be the first takers and leadoff Andrelton Simmons--he couldn’t do much worse than their 2015 output.
The next statistic is what I call Runners On Base Average. The genesis for ROBA is the A factor of Base Runs. It measures the number of times a batter reaches base per PA--excluding homers, since a batter that hits a home run never actually runs the bases. It also subtracts caught stealing here because the BsR version I often use does as well, but BsR versions based on initial baserunners rather than final baserunners do not. Here ROBA = (H + W + HB - HR - CS)/(AB + W + HB).
My 2009 leadoff post was linked to a Cardinals message board, and this metric was the cause of a lot of confusion (this was mostly because the poster in question was thick-headed as could be, but it's still worth addressing). ROBA, like several other methods that follow, is not really a quality metric, it is a descriptive metric. A high ROBA is a good thing, but it's not necessarily better than a slightly lower ROBA plus a higher home run rate (which would produce a higher OBA and more runs). Listing ROBA is not in any way, shape or form a statement that hitting home runs is bad for a leadoff hitter. It is simply a recognition of the fact that a batter that hits a home run is not a baserunner. Base Runs is an excellent model of offense and ROBA is one of its components, and thus it holds some interest in describing how a team scored its runs, rather than how many it scored:
1. CLE (Kipnis), .337
2. SF (Aoki/Pagan/Blanco), .326
3. HOU (Altuve/Springer), .324
Leadoff average, .296
ML average, .286
28. SD (Myers/Solarte/Venable), .267
29. LAA (Aybar/Calhoun/Giavotella), .263
30. MIN (Dozier/Hicks), .257
I will also include what I've called Literal OBA here--this is just ROBA with HR subtracted from the denominator so that a homer does not lower LOBA, it simply has no effect. It “literally” (not really, thanks to errors, out stretching, caught stealing after subsequent plate appearances, etc.) is the proportion of plate appearances in which the batter becomes a baserunner able to be advanced by his teammates. You don't really need ROBA and LOBA (or either, for that matter), but this might save some poor message board out there twenty posts, by not implying that I think home runs are bad, so here goes. LOBA = (H + W + HB - HR - CS)/(AB + W + HB - HR):
1. CLE (Kipnis), .343
2. HOU (Altuve/Springer), .332
3. SF (Aoki/Pagan/Blanco), .331
Leadoff average, .303
ML average, .294
28. CIN (Phillips/Hamilton/Bourgeois), .273
29. LAA (Aybar/Calhoun/Giavotella), .267
30. MIN (Dozier/Hicks), .267
Usually the various OBA lists are pretty stable, and that was the case in 2015 as the Indians, Astros, and Giants leadoff hitters were the best at getting on base regardless of any slight differences in one’s definition of “getting on base” in this context.
The next two categories are most definitely categories of shape, not value. The first is the ratio of runs scored to RBI. Leadoff hitters as a group score many more runs than they drive in, partly due to their skills and partly due to lineup dynamics. Those with low ratios don’t fit the traditional leadoff profile as closely as those with high ratios (at least in the way their seasons played out):
1. CHN (Folwer), 2.3
2. CIN (Phillips/Hamilton/Bourgeois), 2.2
3. MIA (Gordon), 2.0
4. TEX (DeShields/Choo/Martin), 1.9
Leadoff average, 1.6
28. ATL (Peterson/Markakis), 1.3
29. SEA (Marte/Jackson/Morrison), 1.3
30. BOS (Betts/Pedroia), 1.2
ML average, 1.1
You may recall that the Red Sox leadoff hitters led the majors in runs scored per out, so seeing them with the lowest R/RBI ratio suggests they drove in a whole bunch of runs. Their 95 RBI easily led the majors (St. Louis was next with 82). Meanwhile, the Braves and Mariners had the lowest runs scored per out, so they got here more conventionally.
A similar gauge, but one that doesn't rely on the teammate-dependent R and RBI totals, is Bill James' Run Element Ratio. RER was described by James as the ratio between those things that were especially helpful at the beginning of an inning (walks and stolen bases) to those that were especially helpful at the end of an inning (extra bases). It is a ratio of "setup" events to "cleanup" events. Singles aren't included because they often function in both roles.
Of course, there are RBI walks and doubles are a great way to start an inning, but RER classifies events based on when they have the highest relative value, at least from a simple analysis:
1. MIA (Gordon), 1.7
2. CIN (Phillips/Hamilton/Bourgeois), 1.3
3. SF (Aoki/Pagan/Blanco), 1.2
Leadoff average, .8
ML average, .7
28. BOS (Betts/Pedroia), .5
29. MIN (Dozier/Hicks), .5
30. STL (Carpenter/Wong), .5
Since stealing bases is part of the traditional skill set for a leadoff hitter, I've included the ranking for what some analysts call net steals, SB - 2*CS. I'm not going to worry about the precise breakeven rate, which is probably closer to 75% than 67%, but is also variable based on situation. The ML and leadoff averages in this case are per team lineup slot:
1. CIN (Phillips/Hamilton/Bourgeois), 28
2. MIA (Gordon), 21
3. COL (Blackmon), 17
4. TOR (Reyes/Revere/Tulowitzki/Travis), 14
Leadoff average, 4
ML average, 1
28. STL (Carpenter/Wong), -8
29. ATL (Peterson/Markakis), -10
30. CLE (Kipnis), -10
Shifting back to quality measures, beginning with one that David Smyth proposed when I first wrote this annual leadoff review. Since the optimal weight for OBA in a x*OBA + SLG metric is generally something like 1.7, David suggested figuring 2*OBA + SLG for leadoff hitters, as a way to give a little extra boost to OBA while not distorting things too much, or even suffering an accuracy decline from standard OPS. Since this is a unitless measure anyway, I multiply it by .7 to approximate the standard OPS scale and call it 2OPS:
1. HOU (Altuve/Springer), 833
2. BOS (Betts/Pedroia), 823
3. CLE (Kipnis), 823
4. BAL (Machado), 815
5. STL (Carpenter/Wong), 812
Leadoff average, 745
ML average, 730
28. CIN (Phillips/Hamilton/Bourgeois), 641
29. KC (Escobar), 640
30. LAA (Aybar/Calhoun/Giavotella), 639
Along the same lines, one can also evaluate leadoff hitters in the same way I'd go about evaluating any hitter, and just use Runs Created per Game with standard weights (this will include SB and CS, which are ignored by 2OPS):
1. BOS (Betts/Pedroia), 5.6
2. HOU (Altuve/Springer), 5.6
3. COL (Blackmon), 5.4
Leadoff average, 4.4
ML average, 4.2
28. CIN (Phillips/Hamilton/Bourgeois), 3.4
29. LAA (Aybar/Calhoun/Giavotella), 3.2
30. KC (Escobar), 3.1
This is as good of a time as any to note that no park adjustments are applied anywhere in this post, which explains the presence of Colorado (St. Louis was the next highest-ranked NL team with 5.3).
Allow me to close with a crude theoretical measure of linear weights supposing that the player always led off an inning (that is, batted in the bases empty, no outs state). There are weights out there (see The Book) for the leadoff slot in its average situation, but this variation is much easier to calculate (although also based on a silly and impossible premise).
The weights I used were based on the 2010 run expectancy table from Baseball Prospectus. Ideally I would have used multiple seasons but this is a seat-of-the-pants metric. The 2010 post goes into the detail of how this measure is figured; this year, I’ll just tell you that the out coefficient was -.217, the CS coefficient was -.584, and for other details refer you to that post. I then restate it per the number of PA for an average leadoff spot (742 in 2014):
1. HOU (Altuve/Springer), 19
2. COL (Blackmon), 19
3. BOS (Betts/Pedroia), 19
Leadoff average, 3
ML average, 0
28. CIN (Phillips/Hamilton/Bourgeois), -14
29. LAA (Aybar/Calhoun/Giavotella), -19
30. KC (Escobar), -20
The Mets (Granderson) were the top non-Coors NL team at 16. Just to think that a few years ago Billy Hamilton was being hyped as a potential leadoff dynamo, the Angels had Mike Trout doing leadoff duties, and Alcides Escobar…well, I’m pretty sure everyone thought he would be a terrible leadoff hitter.
The spreadsheet with full data is available here.
Tuesday, December 15, 2015
Statistical Meanderings 2015
This is an annual, largely analysis-free look at some things that I found interesting when compiling my end of season statistical reports. My whole series of annual posts will be a little late and a little brief thanks to some computer issues that prevented me from working on them for a few weeks. They might be the better for it:
* Minnesota was 46-35 at home and 37-44 on the road, close to an inverse record. Nothing noteworthy about that. More amusing is that they almost had an inverse R-RA, scoring 373 and allowing 323 at home while scoring 323 and allowing 377 on the road.
* Every year I run a chart showing runs above average (based on park adjusted runs per game) for each playoff team’s offense and defense. Usually I do this and get to slyly point out that the average playoff team was stronger offensively, but that is not the case this year, and it would be bad form not to show it even when there are no guffaws to be had:

Although it is interesting narrative-wise that the Mets’ offense wound up being twenty runs better than their defense.
* There were nine teams whose starters had a lower eRA than their relievers, led by the Dodgers (3.67/4.36) and also including the A’s, Red Sox, Mariners, Cubs, Rays, Braves, Cardinals, and Mets. One might note that four of the five NL playoff teams are represented; only the Pirates had a lower bullpen eRA (4.09/3.50).
In 2014 there were eight teams with a lower starter eRA and two made the playoffs; in 2013 seven with two playoff participants; in 2012 five with just one playoff club; and in 2011 eight and two.
I certainly would not claim that this little piece of trivia demonstrates any larger truth about the importance of starters and relievers, but it certainly is the kind of factoid that could be used in the style of a Verducci to do so. Of course, the blessed Royals completely break the narrative as the team with the biggest difference in favor of their relievers (4.74/3.34; that 1.39 run gap was much higher than the next closest team, the Brewers (4.92/3.88)).
It is also interesting to see the Rays on the list given the attention they got for aggressively pulling starters on the basis of times through the order. Tampa was 23rd in the majors in innings/start, but second to last in the AL (TB starters worked 5.65 innings per game, KC 5.63).
* Speaking of things you’re probably not supposed to say about the Royals, they were an excellent fielding team with a .690 DER, fourth in the majors. But the two teams they best in the AL playoffs each had a better DER (TOR .696, HOU also .690; San Francisco led the NL at .694).
* Minnesota starters had a 4.68 eRA, above the AL average of 4.47 and in the bottom third of the circuit. But this was a big improvement from their deplorable pitching of the last three seasons. That leaves Philadelphia as the team that can make everyone else feel good about their rotations. Phillie starters had a 5.59 eRA, much worse than their closest competition, Colorado at 5.08 (these figures are all park-adjusted). Rockie starters were last in IP/S (5.29, .2 innings fewer than PHI and ARI) and QS% (33%, MIL at 39% and PHI at 41%).
* If you’d have given me ten guesses, I’m not sure I would have come up with San Francisco leading the majors in park adjusted OBA (.342). In my defense it was a BA-driven performance as their .278 BA was nine points better than Detroit and their walk & hit batter per at bat ratio was .097, just three points above the NL average.
* Dellin Betances and Andrew Miller were 1-2 among AL relievers in strikeout rate. Granted he and Miller wouldn't have both been in the same bullpen, but David Robertson was third.
* Evan Scribner had one of the craziest lines you will ever see. He struck out 64 and walked 4 in 60 innings, but he yielded 14 homers, so he was sub-replacement level (I have him at -4 RAR, which is based on runs allowed adjusted for inherited and bequeathed runners). Scribner had the best K/W ratio among relievers; the next best was Kenley Jansen at 80/8.
If you rank AL relievers by the difference between strikeout and walk rate ((K-W)/PA), a better metric, Scribner ranks eighth. The seven relievers ahead of him were all at least 15 RAR except David Robertson (6). The next sub-replacement level relievers on the list are Aaron Loup (17th) and Mike Morin (19th), but both of them were hit-unlucky (.352 and .353 BABIP respectively) and comfortably above average in dRA. To find the next sub-replacement level performance you have to go all the way down to 46th and Danny Farquhar.
Scribner's 2.2 HR/G (games based on 37 PA rather than 9 IP) rate was the highest among major league relievers. The top three AL relievers in HR rate were all A's: Fernando Abad (2.0) and Edward Mujica (1.9), but OAK's HR park factor of 93 is tied for lowest in the AL.
* My stat reports set a minimum of 40 relief appearances to be included as a reliever, but sometimes I cheat and let in players I’m interested in. One case this year was Jeff Manship. Manship pitched 39 1/3 innings over 32 games. But if you include him, he:
1. Led in RRA (.67 to Wade Davis’ ridiculous .75 over 67 1/3 innings)
2. Led in eRA (1.51 to Davis’ 1.79)
3. was 13th in dRA (2.92, teammate Cody Allen led the way at 2.24)
4. And as you probably surmised by now, led the AL in lowest BABIP (.194, Will Harris was next at .201. Manship’s teammate Allen of the league-leading dRA gave up a .348, eleventh worse of the 95 AL relievers)
Terry Francona frequently used Allen in the eighth inning. Allen’s .37 IR/G was fifth among AL relievers with double digit saves, and Roberto Osuna was the only one of those five with twenty or more saves (twenty on the nose and .49 IR/G). Allen allowed only 4/26 inherited runners to score, lowering his 3.38 RA to a 2.86 RRA
* Does Jerry DiPoto know that Joaquin Benoit had a .190 BABIP? (That's not intended as shot at Jerry DiPoto, Benoit was in the news so it stood out.)
* Ground zero for DIPS intrigue was Toronto. Toronto led the majors with a .696 DER, and their starting pitchers with 15 starts were:
1. Marco Estrada, who had the highest ratio of dRA/eRA (basically, my DIPS run average to a component run average, both based on the same Base Runs formula but the latter considering actual singles, doubles, and triples allowed) of any AL starter (4.73/3.40) thanks to a .223 BABIP
2. RA Dickey, who ranked eighth with 4.72/4.00 and as a knuckleballer falls in one of the first categories of pitchers Voros McCracken carved out of DIPS theory
3. Mark Buehrle, whose dRA/eRA ratio in his final (?) season was an unremarkable 4.52/4.41 but who over the course of his career was an occasional DIPS lightning rod
4. Poor Drew Hutchison, who had the third lowest ratio at 4.46/5.50 and was pounded for a .344 BABIP. On the other hand, he had a 13-5 record despite his BABIP-fueled -6 RAR (second worst in the league, ahead of only...)
* One of the more amusing bits of media silliness during 2015 was Bill Madden's fixation on Shane Greene, which included a caption on an article that asked if Shane Greene was Brian Cashman's biggest mistake, and Madden pondering whether the Yankees would still rather have Nathan Eovaldi and Didi Gregorius than Greene and Martin Prado.
Greene was the worst starting pitcher in the AL with -13 RAR.
I like that as a punchline, but the alternate punchline is that while Prado hit fine (20 RAR) for Miami, Gregorius hit enough (only -3 RAA versus an average shortstop) and gave New York their first good fielding shortstop in goodness knows how long, while Eovaldi chipped in 22 RAR. 36 RAR to 7 RAR, I think Cashman is pretty happy with his choices.
* I will point out that my RAR formula includes no leverage adjustment (which I defend), but then leave this without further comment because you can get chastised for talking about this:
2015 RAR
Jake Odorizzi +36
Wade Davis +30
James Shields +26
Wil Myers +14
* Would you concur that it’s plausible that all five of these seasons could have been produced by the same pitcher?

These are by no means the five most similar in value seasons you could pull out of this year’s pitching lines, but they are broadly similar, no? The reason I like this group so much is that the pitchers are John Lackey, Shelby Miller, Jaime Garcia, Carlos Martinez, Lance Lynn, and Michael Wacha. Not only did St. Louis use five clones as their rotation, they traded a sixth away.
* Ichiro was last in the NL in RAR as a 42 year old corner outfielder. His batting average--Ichiro's batting average--was .229. It is almost inconceivable that he will get another job and that my Twitter feed will react with anything but scorn. But sometimes the inconceivable is reality.
* Speaking of Marlins with terrible secondary averages, Dee Gordon posted a .128, same as Suzuki. The only NL hitters with 250 PA and SECs lower than .128 were Milwaukee's sometimes double play combination of Jean Segura (.110) and Hernan Perez (.101). Ben Revere posted a .128 as well, and both Revere and Gordon were above average offensively, but the next lowest SEC by an above-average NL hitter was .151 (Brandon Phillips). I remain skeptical about Gordon's long-term outlook; it is exceedingly rare for a player to be able to remain an offensive contributor with so little to offer other than singles.
Nonetheless, for 2015, Gordon was a defensible choice for the Silver Slugger, as only Joe Panik had a higher RG and he compiled 220 fewer PA. Still not a good look for NL second basemen.
* The Speed Score trajectories of Bryce Harper and Mike Trout have been something I’ve been watching as much has been made of Trout reconstituting his offensive game as more of a power hitter and less of a baserunning threat. But as of last year his Speed Score was still quite high, albeit lower than when he broke in. With a fourth season under his belt, Trout’s Speed Score sequence is 8.7, 7.0, 7.2, 4.9. So 2015 did mark a significant downturn in terms of Trout’s speed manifesting itself through the official statistics (or at least stolen base percentage, stolen base attempt frequency, triples/BIP, and runs scored per time on base).
Meanwhile, Harper’s sequence is 7.5, 4.9, 2.7, 3.0. If that keeps up Dusty Baker will accuse him of clogging the bases.
* The best season you probably weren’t aware of (which is really to say the best season I wasn’t aware of): Logan Forsythe hit .287/.370/.454 over 609 PA, good for 39 RAR. It was basically the same season as Jason Kipnis had trading some BA for SEC.
Monday, November 16, 2015
Hypothetical Ballot: MVP
Some time in early September, the media decided that Josh Donaldson was the AL MVP. I don't purposefully seek out media on the awards, but I've not heard any mainstream support for a non-Donaldson (read: Mike Trout) candidate since that point. Obviously Donaldson has the playoffs and the RBI, but for my money this is not a particularly close race.
Even if you take away park adjustments, which favor Trout to the tune of 7%, I estimate Trout created 124 runs and Donaldson 123. But Trout did that whilst making 26 fewer outs. Third base and center field are essentially a wash when it comes to position adjustments, and the most favorable comparison in the big three fielding metrics for Donaldson is his 11 DRS to Trout's 0 UZR. Bringing park factors back in, I have Trout with 79 RAR and Donaldson 64, leaving Trout ahead even with the most lopsided fielding comparison feasible.
The rest of my AL ballot is pretty straightforward based on the RAR list, with the exceptions of Manny Machado and Lorenzo Cain, who jump up a few spots on the basis of strong showing in fielding (Machado averaged +14 runs in the big three metrics, Cain +17) and baserunning (+3 and +4 after removing steals respectively, per Baseball Prospectus). I regress fielding just enough to let Nelson Cruz hang on to what started as a 15 run RAR lead over Machado, sprinkle in the top four pitchers, and wind up with this ballot:
1. CF Mike Trout, LAA
2. 3B Josh Donaldson, TOR
3. SP Dallas Keuchel, HOU
4. SP David Price, DET/TOR
5. RF Nelson Cruz, SEA
6. 3B Manny Machado, BAL
7. SP Sonny Gray, OAK
8. CF Lorenzo Cain, KC
9. SP Corey Kluber, CLE
10. RF Jose Bautista, TOR
In the National League, there's absolutely no question for me: Bryce Harper had an epic season with 96 RAR, and that's before adding his positive baserunning and fielding contributions. For the first time in his full-time career, Mike Trout would not be my choice for overall MLB MVP.
Behind him, five candidates have seperation for the next five spots on the ballots--the top first basemen Joey Votto and Paul Goldschmidt, and the top three starting pitchers (Jake Arrieta, Zack Greinke, and Clayton Kershaw). Looking solely at offense, Votto and Goldschmidt are basically even; while Votto's fielding is seen as above average, Goldschmidt is strong across the board (+13 FRAA, +5 UZR, and +18 DRS) and BP's baserunning metric has him as a positive (+2) while Votto is a big negative (-6).
Without Goldschmidt's strong ancillary contributions, I would drop him behind two or maybe even three of the pitchers, but I think he's got just enough value to stay ahead of them as is (and yes, I did consider that both Greinke with 5 runs created and Arrieta with 2 added value that wasn't considered in the Cy Young post. Greinke's offensive edge made me tempted to flip him and Arrieta on the MVP ballot, but it would have been to generate a curiosity rather than borne of strong conviction).
Two things worth discussing on the rest of the ballot: AJ Pollock would be here with 57 RAR regardless, but his defense and baserunning graded out well (-3 FRAA, +7 UZR, +14 DRS, +5 BP baserunning) while Andrew McCutchen's did not (-16, -5, -8, -2), enough to jump Pollock ahead of McCutchen who led him with 65 RAR.
1. RF Bryce Harper, WAS
2. 1B Paul Goldschmidt, ARI
3. SP Jake Arrieta, CHN
4. SP Zack Greinke, LA
5. 1B Joey Votto, CIN
6. SP Clayton Kershaw, LA
7. C Buster Posey, SF
8. CF AJ Pollock, ARI
9. SP Max Scherzer, WAS
10. CF Andrew McCutchen, PIT
Thursday, November 12, 2015
Hypothetical Ballot: Cy Young
I think that the Cy Young is the most interesting award to write about from a sabermetric perspective. The MVP debate can be fierce, but it often gets bogged down in semantic arguments about "what is value?" rather than substantive arguments about the candidates' resumes. It seems as if consensus about who is the "best player" is readily found in many years, and then people attempt to construct a narrative by which they can justify ignoring it.
On the other hand, the Cy Young debate is blissfully free from the semantic debate about what the award should represent, and instead discussion can be focused on how one determines the best pitcher. In the nascent days of sabermetrics, this could take the form of a classic ERA v. wins debate. Today, it often is sabermetricians and pseudo-sabermetricians duking it out over which type of performance metric should be used.
The NL race has that potential, while the AL race seems much more straightforward. Dallas Keuchel topped David Price by 12 RAR based on actual runs allowed adjusted for bullpen support. He topped Sonny Gray by 13 RAR and Price by 14 if you look at component statistics (including actual hits allowed). Using a DIPS-like approach, Keuchel was three RAR behind David Price and Corey Kluber. I give the most weight to the first, but unless you go full DIPS, Keuchel pretty clearly offers the best blend. Since Gray only had 35 RAR by DIPS, Price is a clear #2.
The last two spots on my ballot go to Kluber and Chris Archer, edging ahead of Jose Quintana and besting his teammate Chris Sale. Quintana had a slight edge in RAR over Kluber and Archer, but his 4.17 eRA was the worst of any contender and is enough for me to put Kluber and Archer, whose peripherals were stronger than their actual runs allowed, ahead. Sale led the league in dRA at 2.98 thanks to allowing a .331 average on balls in play (his teammate Quintana fared little better at .329), but Kluber and Archer's edge in the non-DIPS metrics is enough to get my vote:
1. Dallas Keuchel, HOU
2. David Price, DET/TOR
3. Sonny Gray, OAK
4. Corey Kluber, CLE
5. Chris Archer, TB
The NL race is a three-way battle between Zack Greinke, Clayton Kershaw, and Jake Arrieta. Greinke has a slight lead in RAR with 88 to Arrieta's 86 and Kershaw's 79. In RAR based on eRA, the two Dodgers are tied with 79 while Arrieta had 85. In dRA (DIPS)-based RAR, Kershaw leads with 72, while Arrieta had 65 and Greinke 48.
In comparing teammates, it becomes more difficult to accept at face value the DIPS position. They pitched in the same park, with the same teammates behind them. That in no way means that the defensive support they received had to have been of equal quality, or that Greinke couldn't have benefitted from random variation on balls in play (this formulation works better than Kershaw being lucky giving that Greinke's BABIP was .235 and Kershaw's .286). The gap in dRA is large, but not large enough for me to wipe out a nine run difference in RAR.
But while Greinke grades out as the Dodger Cy Young, I don't consider his two run lead in RAR over Arrieta significant enough given the latter's edge in the peripherals. While I think Kershaw is the best NL pitcher from a true talent perspective by a significant margin, I think Arrieta is most worthy of the Cy Young.
Max Scherzer is an easy choice for the #4 spot and would probably be in a virtual tie for second with his short-time teammate Price on my AL ballot. The last spot goes to Gerrit Cole over Jacob deGrom and John Lackey; the former was consistently valued by each of the three approaches (51 RAR based on actual runs allowed, 52 based on peripherals and DIPS):
1. Jake Arrieta, CHN
2. Zack Greinke, LA
3. Clayton Kershaw, LA
4. Max Scherzer, WAS
5. Gerrit Cole, PIT
Monday, November 09, 2015
Hypothetical Ballot: Rookie of the Year
In the AL, only one rookie reached 500 plate appearances (five did in the NL) and none reached 150 innings pitched (three in the NL), so there is a dearth of full season candidates for Rookie of the Year honors. The only full-time rookie was Billy Burns, and his 20 RAR was good for just fourth among AL rookie hitters. Still, two rookie shortstops managed to stand out and rise above the pack as the clear 1 and 2 choices for the award. Offensively, Carlos Correa and Francisco Lindor had nearly identical production; Lindor's OBA was eleven points higher, Correa's SLG was twenty points higher. In ten more PA, Correa created three more runs, so the two were nearly identical in RG and RAR. Correa's 33 to 31 RAR lead doesn't hold up, though, when fielding and baserunning are brought into the equation. While both were average baserunners according to Baseball Prospectus (0 and -1 runs respectively), Lindor was +2 in FRAA, +11 in UZR, and +10 in DRS while Correa was -3, 0, -6. That's convincing enough to place Lindor ahead on my ballot.
One thing to note is that I think Correa's performance was more impressive than Lindor's in terms of "prospect" status, but I don't think that's what the award is for. Correa is a year younger and his offensive performance was less dependent on a high batting average (Lindor hit .313 with a .249 SEC, Correa hit .279 with a .339 SEC) and Lindor's power output was higher than most expected. But while that matters going forward, I think Lindor was a more valuable player in 2015.
Lance McCullers, Nate Karns, Andrew Heaney, and Carlos Rodon were all candidates for ballot spots from the pitching side. I chose to value Karns' 147 innings over Heaney and Rodon's better peripherals. Miguel Sano was sixth in the AL in RG among players with more than 300 PA (basically equivalent to Edwin Encarnacion and Jose Bautista), but with just 333 PA and questionable value as a fielder or baserunner. So I have it:
1. SS Francisco Lindor, CLE
2. SS Carlos Correa, HOU
3. SP Lance McCullers, HOU
4. DH Miguel Sano, MIN
5. SP Nathan Karns, TB
The NL race is not close, as Kris Bryant put up a 50 RAR season and wasn't panned by the fielding metrics (-2 FRAA, +5 UZR, +3 DRS). Matt Duffy was thirteen runs behind offensively and was seen to be a good fielder, but even using the fielding metrics with no accounting for the additional uncertainty, Bryant would still be ahead. Joc Pederson and Jung Ho Kang are the other top position player candidates with 29 and 28 RAR, but FRAA hates Pederson (-19) while UZR and DRS just dislike him (-4 and -3 respectively). And yes I'm intentionally being silly by suggesting that the metrics like or dislike players. The consensus on Kang was slightly above average, which makes him the clear #3 hitter. Randal Grichuk is in the mix at 26 RAR, and one could certainly make a fielding case to put him ahead of Pederson.
Among pitchers, Noah Syndergaard's 29 RAR bests Anthony DeSclafani's 24, and Thor's peripherals are right in line with his RRA. So I see it as:
1. 3B Kris Bryant, CHN
2. 3B Matt Duffy, SF
3. SS Jung Ho Kang, PIT
4. SP Noah Syndergaard, NYN
5. CF Joc Pederson, LA
Monday, November 02, 2015
Royal Mythology
Rarely has the performance of a single team led to so many attempts to rationalize, explain, project virtue, and the like as the 2014-15 Royals. Focusing on the 2015 edition, here are just a handful of Royals myths that I have been particularly annoyed at hearing. The "analysis" that follows is not comprehensive nor is it intended to be. That's kind of the point. The level of extraordinary claims that have been made about the Royals should be apparent even with the crudest of inquiries into the objective record.
Myth #1: Whatever the Heck Andy McCullough Tweeted
"The entire point of the Royals is that baseball is a hard game and if you make your opponent do things, sometimes they will screw up"
The Kansas City Royals reached based on error 58 times in 2015. The AL average was 57. In 2014 they had 51 ROE versus a league average of 57.
Myth #2: The Royals Don't Make Mistakes
Errors leave a lot to be desired as a metric, but when traditional thinkers talk about making mistakes, errors are first and foremost on their mind. The 2015 Royals had a mFA of .973; the AL average was .971. The 2014 Royals had a mFA of .968; the AL average was .970.
Myth #3: The Royals had a long World Series drought
There are 30 MLB teams. It should be obvious, then, that 30 years is the expected time between world titles. Thus a streak of thirty years is not particularly long in theory. It's also not long in practice, as it was only the 12th longest drought (the Mets had the 13th longest drought). Last year en route to the pennant, two of the three teams Kansas City beat had (slightly) longer droughts and the other had a slightly shorter drought.
To find the Royals worthy of any particular sympathy, one must give extra credit for how poorly the franchise performed for much of that period. While this is unfortunate for the fans, it seems like such a group would be less traumatized by losing the World Series and more appreciative just to get there. Fan "suffering" is very low on my list of factors in deciding which teams to pull for in the playoffs, but to the extent I consider it, I tend to side with teams that have been good and just have not had the bounces go their way in October. Teams like the Marlins and the Royals who parlay their only two playoff teams in an extended period into pennants and world titles are quite galling to anyone who has rooted for a titleless yet competent franchise.
But more broadly, I think that the media and fans have yet to understand how championships will be distributed over the long haul in leagues that are double or close to it in size from what they were for so many years. Lengthy droughts, the types that the Red Sox, Cubs, or to a lesser extent Indians and Giants have suffered will be quite commonplace. Basic logic tells you that they have to be.
I did a "simulation" (which is a pretentious way of saying I used the RAND() function in Excel) to simulate 1,000 seasons of a thirty-team league in which each team had a 1/30 chance to win the World Series in any given year. Remember, this is the height of competitive balance. The probability of a championship could not be any more evenly distributed. There are no market disadvantages, no bad franchise stewardship, no billy goats. It is theoretically possible that the timing of championships could be more evenly distributed, but admittedly my imagination is insufficient to describe a specific scenario that would force a more even temporal distribution.
After 1,000 years, the average team should have had 33 1/3 titles. The most successful had 45; the two least successful each had 22 (as an aside, and granting that it was a sixteen team universe for an extended period, think about the Yankees' 27 in this context).
For years 501-1000, I calculated the average of the quartiles, as well as the percentage of active droughts as of a given year greater than 30 years. Since droughts for these 500 years are not independent of one another, be cautious with extrapolating those averages to anything else (for what it's worth, the medians are similar).
The average for these seasons was a first quartile drought of 8.4 years; a median drought of 20.2 years; a third quartile drought of 39.8 years, and a maximum drought of 115.0 years. In the average season, 34.4% of droughts exceeded 30 years (note that the current MLB figure is 12/26 = 46.2% of droughts exceeding 30 years, excluding the four subsequent expansion franchises, which suggests but in no way proves that, not surprisingly, the observed title distribution is not as egalitarian as the theoretical one used here).
Freezing it at year 1,000, this is what the drought picture looks like:

Even with new champions in 7 consecutive and 16 out of 20 seasons, a pretty typical 1/3 of droughts exceed 30 years, one team has exceeded the Cubs, and two more have exceeded the Indians.
The longest drought for any team during the millennium was 215 years. The poor fans of Team 6 celebrated a title in year 306, then went through many generations (or not, who knows, it's the future) before finally winning again in year 622. Then they waited another 120 years for good measure. Should baseball survive for 1,000 years with 30 or more teams, think about all of the narratives that the sportswriters of the future will get to craft.
Myth #4: The Royals Need to Be Explained
This is more of a meta-analytical comment than specific to the Royals, but there is an underlying notion, seen even on some sabermetrically-inclined outlets, that the Royals are an anomaly that demands our attention and an explanation. Please note that I am not criticizing the act of questioning ones premises, of attempting to update hypotheses as new data becomes available, of recognizing that we don't know everything about baseball, or anything of the sort. This all laudable. But such inquisition must not be confused with an imperative to find fault in one's null hypotheses either.
But there all too often is a reflexive desire to be too conciliatory, too eager to throw out one's existing knowledge and toolkit in an attempt to explain something that may just be a fluke. Witness "The Year That Base Runs Failed" (an article that demands a thorough undressing that I just do not have the will to give justice to right now). Recently this has seemed to manifest itself more at outlets that rely on 1) boisterous, opinionated writers and 2) daily content production.
When you are boisterous and opinionated, you need your opinions to be right in order to maintain credibility. If you have to blame the tools (Base Runs, W% Estimators, the entirety of sabermetric theory) that you used to justify your initial opinion, that's fair game. On the other hand, my position on the Royals doesn't demand I apologize for it (maybe I should--as I acknowledged above, I could be wrong, and inquiry into why that might be the case is healthy). My position is simply that the Royals were a fairly average team as indicated by their component statistics, but that sometimes teams outplay their component statistics. The Royals made the playoffs and over two seasons went 22-9, but a .500 team would go 22-9 or better with 1.5% probability--it's not likely but it also must happen now and again. You can disagree, but it's inherently a passive argument.
If you need to produce content daily, then you have to write about something, and writing "the sample size precludes us from drawing firm conclusions" over and over again doesn't drive readership. So there's a temptation to overfit your model, to declare that the secret sauce has been found, to cheat on the degree of certainty you require before you declare correlation to be causation, to investigate one positively correlated variable at the expense of other potential explanatory variables, to overreact to a year in which your metric's standard error is higher than it typically is.
Even great sabermetricians can get caught in this trap, and I have never been confused with a great sabermetrician but I have written things along these lines that I am not proud of as well. Bill James and Nate Silver have both, using different but understandable means when considered in the context of their work, failed pretty miserably at predicting playoff success based on historical data. The simple fact of the matter is that there were 32 playoff games (not counting the wildcard games) this season, which is fairly typical. At 30 games/season, you need five seasons to have a sample size the same as that of one major league team-season.
This is particularly problematic when so many of the attempts to explain playoff performance are based on theories about changes in the game. Contact superseding Moneyball, bullpen construction and usage patterns which have been in a constant state of change throughout baseball history...you could never have credible data without the conditions of the game shifting. This is not to say don't try to advance our understanding, it's to say be extremely cautious as you attempt to do so.
So what winds up happening is that a potential explanation ("Contact works, allow it" is a particularly poor paraphrase since it makes it sound like your pitchers should allow contact, but I saw that Colin Cowherd promo to many times not to use it) is honed in on, and maybe there's evidence of some effect, so other potential explanatory variables are ignored and the correlation is exaggerated and soon there's a truism that must be disproved rather than a hypothesis which must be proved.
There's a difference between saying "I don't know" and "No one will ever know". If it seems as if my school of thought arrives at the latter, that's a fair criticism. But I personally would rather be too certain about how much I can't know than to be too quick to think I've learned something new.