For the last few years I have published a set of team ratings that I call "Crude Team Ratings". The name was chosen to reflect the nature of the ratings--they have a number of limitations, of which I documented several when I introduced the methodology.
I explain how CTR is figured in the linked post, but in short:
1) Start with a win ratio figure for each team. It could be actual win ratio, or an estimated win ratio.
2) Figure the average win ratio of the team’s opponents.
3) Adjust for strength of schedule, resulting in a new set of ratings.
4) Begin the process again. Repeat until the ratings stabilize.
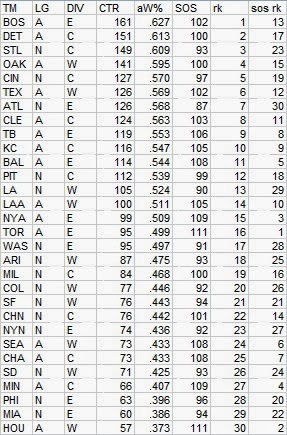
First, CTR based on actual wins and losses. In the table, “aW%” is the winning percentage equivalent implied by the CTR and “SOS” is the measure of strength of schedule--the average CTR of a team’s opponents. The rank columns provide each team’s rank in CTR and SOS:

This was a banner year for those of us who prefer the best teams to make it through the playoffs, as the pennant winners ranked one-two in MLB. The ten playoff teams were also the ten that had the most impressive win-loss records, with the exception of #9 Texas, but of course they had a shot in the one game playoff. Also, the Rangers were still only fifth in the AL so it’s not as if their schedule unfairly kept them out. What is a departure from recent seasons is that no other also-ran AL teams finished with higher ratings than the NL playoff qualifiers. Still, the AL dominated the top spots again as can be seen by the fact that only St. Louis snuck into the top five.
Below are the mean ratings for each league and division, actually calculated as the geometric rather than arithmetic mean:

Last year, the AL-NL gap was 112-89, and if you count Houston with the NL it was 106-88 in 2013. In any event, the AL remains the stronger league based on the interleague results (which is what underpins any differences in these rankings), with an implied W% of .521 against the NL.
Speaking of Houston, they actually ticked up a bit in CTR, from 46 to 48. While I wouldn’t claim that is a meaningful difference, it does indicate that their four win drop is largely a function of opponent quality, moving from the 21st most difficult schedule in 2012 to 4th in 2013. They also provide a good opportunity to point out that the schedule rankings are dependent on the quality of the team in question--Houston's schedule was tougher than that of their divisional opponents because they did not get the benefit of playing nineteen games against Houston.
Schedule can make a big difference when comparing two teams across leagues, in a tough and weak division--naturally, the largest schedule disparity is between the winner of the weakest division (NL East) and cellar dweller of the strongest (AL East). In the actual tallies, Atlanta was 96-66 and Toronto was 74-88. However, the ratings (as indicated by aW%) suggest that Atlanta was equivalent to a 92-70 team and Toronto to 78-84, an eight game swing in a head-to-head comparison. Atlanta’s SOS of 90 and Toronto’s of 112 implies that Toronto’s average opponent would have a .554 W% against Atlanta’s average opponent--comparable in 2013 CTR terms to the Dodgers or Rangers.
I will present the rest of the ratings with minimal comment. The next set is based on Pythagenpat record from R/RA:
Next is based on gEW%, which is explained in this post--some of the other exhibits for the annual post on that metric are a little more involved so I’m running these ratings first. The basic idea of gEW% is to take into account (separately) the distribution of runs scored and runs allowed per game for each team rather than simply using season totals as in Pythagenpat:

And finally, based on Runs Created and Allowed run through Pythagenpat:

These ratings are based on regular season data only, but one could also choose to include playoff results in the mix. Regardless of what your thoughts may be on the value of considering playoff data, it is most commonly omitted simply because of the way statistics are presented. It usually takes extra effort to combine regular season and playoff data.
So I decided to run the win-loss based ratings with playoff records and schedules included, and to see how large a difference it would create in the results. I was a little surprised by the results:

It’s not a surprise of course that Boston strengthened its rating--the Red Sox went 11-5 against very good competition. What did surprise me was that the only other playoff team to have a noticeable change in rating was Atlanta. Their 1-3 record against the Dodgers pushed their rating down by four points. Much of the movement in ratings for the other teams was felt by non-playoff teams whose SOS numbers fluctuated, in particular the AL East in which each team gained a point, and the NL in general, whose collective rating was pushed further down.
An angle that could make the playoff-inclusive ratings more interesting would be if I included regression in the ratings, which I do not. My reasoning is that I intend the ratings to be a reflection of the actual results of the season rather than an attempt to measure true quality of the teams. Additionally, regression would have little impact on the rank order of teams--it would mostly serve to compress the variance of the ratings. On the other hand, even if one wants to use the actual record of a team untouched to establish its rating, the case can be made that its opponents’ records should still be regressed, to avoid overcompensating for strength of schedule in ratings. Some purveyors of team ratings in other sports take a similar approach in basing calculations of opponent strength on those teams’ point-based rankings, but still base each team’s own rating on their actual wins and losses.
Again, though, these ratings are advertised as crude and are clearly only intended to be used in viewing 2013 retrospectively, so I’ve not bothered with regression here. I do use regression on the rare occasions when I use the CTRs to give crude estimates of win probabilities (such as playoff odds).
Tuesday, January 14, 2014
Crude Team Ratings, 2013
Subscribe to:
Post Comments (Atom)
Could you share how and by how much these figures would be regressed for estimates of win probabilities? How much would they be regressed 1/4 of the way through the season, 1/2, 3/4, during the playoffs, etc.?
ReplyDeleteI use the rule of thumb developed by Tango of adding in 69 games of .500 performance. So regressed W% would be equal to (W + 34.5)/(W + L + 69). These ratings are based on win ratio, and I build the regression in to the win ratios that are inputted to develop the ratings rather than the ratings themselves, so the win ratio would be equal to (W + 34.5)/(L + 34.5).
ReplyDelete