Even for this series, this is an esoteric topic, but I wanted to specifically explore how Enby, Cigol, runs per win, Pythagorean exponent, etc. behaved around 1 RPG. 1 RPG is not a particularly interesting point from a real-world baseball perspective. Take 20 RPG. This is an outlandish level of scoring for teams, but one can easily imagine a theoretical scenario constructed from real players, and using the types of constructs that have sometimes been used by sabermetricians (for instance, a team of Babe Ruths with average pitching playing a team of Ty Cobbs with average pitching) in which 20 RPG would be the context. But 1 RPG? Maybe if you have a team of Rey Ordonezes facing Pedro Martinez 1999, but Pedro Martinez 1999 is backed by a team of Bill Bergens and they have to face Lefty Grove 1931?
Still, 1 RPG is of interest in the world of win estimators, as it is the point that led to Pythagenpat (and thus my own intense interest in win estimators). As you know, 1 RPG is the minimum possible scoring level since a game doesn’t end until at least one run is scored. This insight, which to my knowledge was first proffered by David Smyth, led to my discovery of the Pythagenpat exponent (and I believe Smyth’s as well). So it will always hold a special interest to me, regardless of how impractical any application may be.
In order to facilitate this, I expanded my list of Enby and Cigol parameters (the difference is that Enby uses c = .767 in the Tango Distribution and Cigol uses c = .852) to look at each .05 RPG interval from .05 - 1.95. First, using the Enby pararmeters is a graph of the estimated probability of scoring X runs for teams that average .5, 1, 1.5, and 2 R/G:

I deliberately cut-off the .5 R/G team’s probability of being shutout, which is 68.7%, in order to increase the space available for other points by about 40%. One thing that should stand out if you’ve looked at any of the other graphs of this type I’ve posted is that the distinctive shape (which for the lack of a more precise term I’ll call left tail truncated, extremely elongated right tail bell curve) is not present. For all of these teams except the 2 R/G, the probability of scoring x+1 runs is always lower than the probability of scoring x runs. The 2 R/G team is actually the first at .05 intervals that achieves this modest success; teams that average 1.95 R/G are expected to be shutout in 25.1% of games and score one run in 25.0%. At 2, it is 24.3% and 24.7% respectively.
My real interest with these teams is how RPW and Pythagenpat exponent might behave at such low levels of scoring. In order to test this, I generated a Cigol W% for each possible matchup between teams average .05 - 2 R/G at intervals of .05. I included inverse matchups (e.g. 1.25 R/G and 2 RA/G as well as 2 R/G and 1.25 RA/G), but eliminated cases where R = RA (obviously W% is .500 at these points). I also eliminated cases in which R + RA < 1, since these are impossible:

The relationship between RPG and RPW, even in this extremely low scoring context, is generally as we’d expect. The power regression line is a decent fit and takes a very satisfying form, as Pythagenpat RPW can be shown to be equal to 2*RPG^(1 - z). The implied z value here is lower than the .27 - .29 used for more normal environments, but close enough to suggest that Pythagenpat, which is correct by definition at 1 RPG, remains a useful tool at slightly higher RPGs.
To test that more directly, we can look at the required Pythagorean exponents for these teams plotted against RPG as well:

This graph is less encouraging. At first glance the most disturbing this is that the power regression doesn’t do a great job of fitting the data, as it produces Pythagorean exponents too low for the higher scoring contexts. The only way to achieve a RPG approaching 4 given how I defined this dataset is to have teams that are fairly evenly matched, while wide gaps in team quality can pop up at low RPG (for example, we could get 1 RPG from .05 R/.95 RA at one extreme of imbalance or .5 R/.5 RA at the other). This again suggests that the imbalance between the two teams has a material impact on the needed Pythagorean exponent, but one that I’ve as of yet been unable to successfully capture in a satisfactory equation.
The more alarming thing about these results is they show a fraying of the Cigol W% estimates from Smyth’s logical conclusion that underpins Pythagenpat--namely that a 1 RPG team will win the same number of games as runs they score. For the nine unique pairs of R/RA (not counting their inverses), the Cigol W% is off slightly, as you can see the needed Pythagorean exponents at 1 RPG are not equal to 1:
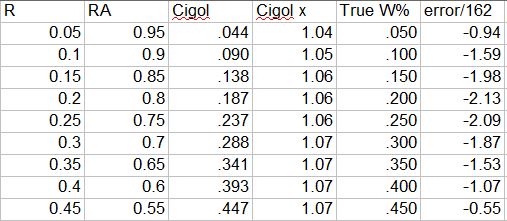
True W% is equal to R/G, and the error/162 is (Cigol W% - True W%)*162. The errors are not horrible, all well within one standard deviation of the typical Pythagenpat error for normal major league teams, but they still could into question the theoretical validity of the Cigol estimates in extremely low scoring contexts.
I redid the graph by replacing the Cigol estimates for these nine teams and their inverses with the True W%. This only corrects the W% for cases where we think for the moment that by definition Cigol is wrong; if that is so, Cigol is likely causing significant distortions at scoring levels just above 1 RPG as well, which are not corrected. I never expected Cigol to be a perfect model (or, to phrase it more precisely, I never expected any actual implementation of Cigol to be a perfect model; the mathematical underpinnings of Cigol, given the assumption of independence of runs scored and allowed, are true by definition), but I have written much of this series as if Cigol and the previously unnamed “True W%” were one in the same. This is not the case, but it is always a bit disappointing when you find a blemish in your model.
With these corrections, we have this graph and regression equations:

This doesn’t do much to change the regression equations (changing eighteen observations out of 1,398 generally will not), but at least it looks better to have observations at (1, 1). I don’t have any correction to offer to Enby/Cigol itself to solve this problem; my inclination is to assume there are two problems at play:
1) that the estimate probability of being shutout, the Enby parameter z, for which I use the Tango Distribution to estimate, doesn’t hold up at these extremely low scoring levels. Maybe the Tango Distribution c parameter, which varies based on whether the question revolves around one team’s runs per inning scoring distribution or at matchup between two teams, inherently assumes covariance between R and RA that doesn’t hold when only one team scores in a game by definition (at 1 RPG, and many other games between teams for which RPG is slightly greater than 1 would end 1-0 as well). But that is just a guess, and one that might appear to a reader to throw the other method under the bus. I don’t mean it in that way at all, of course; the Tango Distribution was not developed to be an input into a runs/game distribution.
2) Regardless of the z parameter, Cigol assumes that runs scored and runs allowed are independent between the two teams and from game to game. But when I say that a team that plays scored .6 R/G and allows .4 must have a .600 W%, I am referring to a team that has actually put up those figures over some period of time. This is still not the same as saying that the team is a true .6/.4 team. And so there is not necessarily a flaw in Cigol at all. Enby (using the c = .852 parameters) expects a true talent .6 R/G team to score more than one run in 13.9% of their games. So it would be extremely unlikely that any team, even at these ridiculously low scoring levels, could ever produce a 1 RPG over a period of several games or longer.
But redefining the question in terms of true talent means that you could have a true talent .3 R/.4 RA team, for instance. I unceremoniously tossed these teams out of the dataset earlier, but they should have been included. So I will quickly look at Cigol’s estimate of the necessary Pythagorean exponent for these teams (these are teams scoring and allowing .05 - .9 runs per game at intervals of .05 with a total R+RA < 1):

This isn’t interesting except as confirmation that the lower bound for the exponent is 1, which means that Pythagenpat fails for these teams. Pythagenpat will allow these teams to have exponents below 1. For example, .5 RPG is a Pythagenpat exponent around .5^.28 = .824.
For the sake of the rest of this discussion, I will no longer hew to a strict requirement that the exponent be equal to 1 at any point (only that it never dip below 1). In its place, let me propose an alternate set of rules for an equation to estimate the Pythagorean exponent to be valid:
1) the exponent must always increase with RPG if R = RA (or, the equation need not be strictly limited to using RPG; however, it must strictly increase with RPG for a theoretically average team. I don’t know for sure that this is a theoretical imperative, but I want to preclude the use of a quadratic model that might appear to be a good fit but with a negative coefficient for the x^2 term which results in a negative derivative when x is large
2) the exponent must be close to 1 at 1 RPG. If we came up with a power regression that said the exponent = 1.02*RPG^.272, for instance, that would be fine. It’s close to 1.
Once I decided that I didn’t need to adhere to the constraint that x = 1 when RPG = 1, I tried a number of forms of x = RPG^z plus some other term that incorporated run differential. Here are a handful of the more promising ones:
x = 1.03841*RPG^.265 + .00114*RD^2 (RMSE = 4.0084)
x = 1.04567*RPG^.2625 + .00113*RD^2 (RMSE = 4.0082)
x = 1.05299*RPG^.26 + .00113*RD^2 (RMSE = 4.0080)
x = 1.05887*RPG^.258 + .00113*RD^2 (RMSE = 4.0077)
x = 1.03059*RPG^.27 + .16066*(RD/RPG)^2 (RMSE = 4.0076)
x = 1.04561*RPG^.265 + .15274*(RD/RPG)^2 (RMSE = 4.0076)
x = 1.01578*RPG^.275 + .16862*(RD/RPG)^2 (RMSE = 4.0080)
I must have run thirty regressions, looking for some formula that would beat 4.0067 (the minimum RMSE for an optimized Pythagenpat for 1961-2014 major league teams). Just to give you an idea of how silly I got, I tried this equation to estimate x (the Pythagorean exponent, eschewing the Pythagenpat construct):
x = 10^(.30622 * log(RPG) + .0091*log(RD^2/RPG) - .01342) (RMSE = 4.011)
Abandoning for a moment the attempt to get a lower RMSE with major league teams, how do those equations fare with the full Cigol dataset compared to Pythagenpat? In this case the RMSE is comparing the estimated W% from the formula in question to the Cigol estimate. Using z = .2867 (the value that optimizes RMSE for the 1961-2014 major league teams), the RMSE (per 162 games) is .46784. Using z = .2852 (the value that optimized RMSE for the full Cigol dataset), the RMSE is .46537. For each of the equations above:
x = 1.03841*RPG^.265 + .00114*RD^2 (RMSE = .37791)
x = 1.04567*RPG^.2625 + .00113*RD^2 (RMSE = .40180)
x = 1.05299*RPG^.26 + .00113*RD^2 (RMSE = .42551)
x = 1.05887*RPG^.258 + .00113*RD^2 (RMSE = .44487)
x = 1.03059*RPG^.27 + .16066*(RD/RPG)^2 (RMSE = .56590)
x = 1.04561*RPG^.265 + .15274*(RD/RPG)^2 (RMSE = .60852)
x = 1.01578*RPG^.275 + .16862*(RD/RPG)^2 (RMSE = .52524)
At least we can do better with the full Cigol dataset with a more esoteric construct than just using a fixed z value. But the practical impact is very small, and as we’ve seen these formulas add nothing to the accuracy of estimates for normal major league teams and sacrifice a bit of theoretical grounding.
Wednesday, May 29, 2019
Enby Distribution, pt. 10: Behavior Near 1 RPG
Subscribe to:
Post Comments (Atom)
No comments:
Post a Comment
I reserve the right to reject any comment for any reason.