Showing posts with label Park Factors. Show all posts

Thursday, December 03, 2020

Palmerian Park Factors

The first sabermetrician to publish extensive work on park effects was Pete Palmer. His park factors appeared in The Hidden Game of Baseball and Total Baseball and as such became the most-widely used factors in the field. They continue in this role thanks to their usage at Baseball-Reference.com.

Broadly speaking, all ratio-based run park factors are calculated in the same manner. The starting point is the ratio of runs at home to runs on the road. There are a number of different possible variations; some methods use runs scored by both teams, while others (including Palmer’s original methodology in The Hidden Game use only the runs scored by one of the teams (home or road)). The opportunity factor can also vary slightly; many people just use games, which is less precise than innings or outs. The variations are mostly technical rather than philosophical in nature, so they rarely get a lot of attention. Park factor calculations are accepted at face value to an extent that other classes of sabermetric tools (like run estimators) are not.

Among park factors in use, the actual computations in Palmer’s are the most unique, so I thought it would be worthwhile to walk through his methodology (as stated in Total Baseball V) and discuss its properties.

In the course of this discussion, I will primarily focus on the actual calculations and not the inputs. Where Palmer has made choices about what inputs to use, how to weight multiple seasons, and the like, I will not dwell, as I’m more interested in the aspects of the approach that can be applied to one’s own choice of inputs. Palmer uses separate park factors for batting and pitching (more on this later); I’ll focus on the batting ones here.

Palmer generally uses three years of data, unweighted, as the basis for the factors. There are some rules about which years to use when teams change parks, but those are not relevant to this discussion. The real meat of the method starts by finding the total runs scored and allowed per game at home and on the road, which I’ll call RPG(H) and RPG(R).

i (initial factor) = RPG(H)/RPG(R)

I will be using the 2010 Colorado Rockies as the example team here, considering just one year of data to keep things simple. Colorado played 81 games both home and away, scoring 479 and allowing 379 runs at home and scoring 291 and allowing 338 on the road. Thus, their RPG(H) = (479 + 379)/81 = 10.593 and RPG(R) = (291 + 338)/81 = 7.765. That makes i = 10.593/7.765 = 1.364 (I am rounding to three places throughout the post, which will cause some rounding discrepancies with the spreadsheet from which I am reporting the results).

The next step is to adjust the initial factor for the number of innings actually played rather than just using games as the denominator. This step can be ignored if you begin with innings or outs as the denominator rather than using games. The Innings Pitched corrector is:

IPC = (18.5 - Home W%)/(18.5 - (1 - Road W%))

Palmer explains that 18.5 is the average number of innings batted per game if the home team always bats in the ninth inning. Teams that win a higher percentage of games at home bat in less innings due to skipping the bottom of the ninth. The IPC seems to assume that in all games won by the home team, they do not bat in the bottom of the ninth.

Colorado was 52-29 (.642) at home and 31-50 on the road (.383), so their IPC is:

IPC = (18.5 - .642)/(18.5 - (1 - .383)) = .999

The initial factor is divided by the IPC to produce what the explanation refers to as Run Factor:

RF = i/IPC

For the Rockies, RF = 1.364/.999 = 1.366

The next step is the Other Parks Corrector (OPC). The OPC “[corrects] for the fact that the other road parks’ total difference from the league average is offset by the park rating of the club that is being rated.” The glossary explanation may be confusing, but the thought process behind it is pretty straightforward--a team’s own park makes up part of the league road average, but none of the team’s own road games are played there. Without accounting for this, all parks would be estimated to be more extreme than they are in reality.

The OPC is figured in the same manner as I do it in my park factors; I borrowed it from Craig Wright’s work without realizing that Palmer had done the same mathematical operation, but its derivation is fairly obvious and the equivalent appears in multiple park factor approaches. Let T equal the number of teams in the league:

OPC = T/(T - 1 + RF)

Basically, OPC assumes a balanced schedule, so each team’s schedule is made up half of games in its own park (hence the use of RF) and half in the other parks, of which there are T - 1. For a sixteen team league (and thus Colorado 2010):

OPC = 16/(16 - 1 + 1.366) = .978

The next step is to multiply RF by OPC, producing scoring factor:

SF = RF*OPC

For Colorado, SF = 1.366*.978 = 1.335

If all you were interested in was an adjustment factor of the park effect’s on scoring, rather than specific adjustments for the team’s batters and pitchers, this would be your stopping point. The scoring factor is the final park factor in that case, and with the exception of the Innings Pitched Corrector, it is equivalent to the approach used by Craig Wright, myself, and many others. (My park factors are then averaged with one to account for the fact that only half of the games for a given team are at home, but that only obscures the fact that the underlying approach is identical, and Palmer accounts for that consideration later in his process).

It is when the other factors are adjusted for that the math gets a little more involved. The first step is to calculate SF1, which is an adjustment to scoring factor:

SF1 = 1 - (SF - 1)/(T - 1)

For the 2010 Rockies:

SF1 = 1 - (1.335 - 1)/(16 - 1) = .978

While I am writing this explanation, I must stress that it is a walkthrough of another person’s method. I cannot fully explain the thought process behind it and justify every step. I decided to include that disclaimer at this point because I don’t understand what the purpose of SF1 is, as it is mathematically equivalent to OPC. Why it needed to be defined again and in a more obtuse way is beyond me.

In any event, the purpose of SF1 is to serve as a road park factor. If a team plays a balanced schedule and we take as a given that the overall league park factor should be equal to one, but we determine that its own park has a PF greater than one (favors hitters), then it must be the case that the road parks they play in have a composite PF less than one. That’s the function of the OPC, and of SF1. For the rest of this post, I will refer to OPC rather than SF1 when it is used in formulas.

Palmer uses separate factors for batters and pitchers to account for the fact that a player does not have to face his teammates. By doing so, Palmer’s park factors make their name something of a misnomer as they adjust for things other than the park. (One could certainly make the case that the park factor name is constantly misapplied in sabermetrics, as we can never truly isolate the effect of the park, and the sample data we have is affected by personnel and other decisions. Palmer takes it a step further, though, by accounting for things that have nothing to do with the park.) The park effect is generally stronger than the effect of not facing one’s own teammates, since a team plays in its park half the time but only misses out on facing its own pitchers 1/T percent of the time assuming a balanced schedule.

One can argue about the advisability of adjusting for the teammate factor at all, and if so it certainly is debatable whether it should be included in the park factor or spun off as a separate adjustment. I would find the later to be a much better choice that would result in a much more meaningful set of factors (both for the park and teammates), but Palmer chose the former.

The separate factors are calculated through an iterative process. One must know the R/G scored and allowed at home and away for the team (I’ll call these RG(H), RG(R), RAG(H), and RAG(R) for R/G at home, R/G on the road, RA/G at home, and RA/G on the road respectively). Additionally, one must know the average RPG for the entire league (which I’ll call 2*N, since I often use N to denote league average runs/game for one team). For the Rockies, we can determine from the data above that RG(H) = 5.913, RG(R) = 3.593, RAG(H) = 4.679, RAG(R) = 4.173, and N = 4.33.

The iterative process is used to calculate a team batter rating (TBR) and a team pitcher rating (TPR, not to be confused with Total Player Rating, another Palmer acronym). These steps are necessary since the strength of each unit cannot be determined wholly independently of the other. Just as the total impact of park goes beyond the effect on home games and into road games (necessitating the OPC, but not being of strong enough magnitude to swamp over the home factor), so the influence of the two units on another are codependent.

The first step of the process assumes that the pitching staff is average (TPR = 1). Then the TBR can be calculated as:

TBR = [RG(R)/OPC + RG(H)/SF]*[1 + (TPR - 1)/(T - 1)]/(2*N)

For Colorado:

TBR = [3.593/.978 + 5.913/1.335]*[1 + (1 - 1)/(16 - 1)]/(2*4.33) = .936

The first bracketed portion of the equation adds the teams’ adjusted (for park) R/G at home and on the road, using the home (SF) or road (OPC) park factor as appropriate. The second set of brackets multiplies the first by the adjustment for not facing the team’s pitching staff. The difference between the team pitching and average (TPR - 1) is divided by (T - 1) since playing a true balanced schedule, the team would only face those pitchers in 1/(T - 1) percent of the games anyway. If the team’s pitchers are above average (TPR < 1), then the correction will increase the estimate of team batting strength.

Then the entire quantity is divided by double the league average of runs scored per game by a single team. This may seem confusing at first glance, but it is only because the first bracketed portion did not weight the home and road R/G by 50% each. The formula could be written as the equivalent:

TBR = [.5*RG(R)/OPC + .5*RG(H)/SF]*[1 + (TPR - 1)/(T - 1)]/N

In this case, it is much easier to see that the first bracket is the average runs scored per game by the team, park-adjusted. Dividing this by the league average results in a very straightforward rating of runs scored relative to the league average. Both TBR and TPR are runs per game relative to the league average, but in both cases they are constructed as team figure/league figure. This means that the higher the TBR, the better, with the opposite being true for TPR.

The pitcher rating can then be estimated using the actual TBR just calculated, rather than assuming that the batters are average:

TPR = [RAG(R)/OPC + RAG(H)/SF]*[1 + (TBR - 1)/(T - 1)]/(2*N)

For the Rockies, this yields:

TPR = [4.173/.978 + 4.679/1.335]*[1 + (.936 - 1)/(16 - 1)]/(2*4.33) = .894

The first estimate is that the Rockies batters, playing in a neutral park and against a truly balanced schedule, would score 93.6% of the league average R/G. Rockie pitchers would be expected to allow 89.4% of the league average R/G. At first when I was performing the sample calculations, I thought I might have made a mistake since the Colorado offense was evaluated as so far below average, but I was forgetting that they would appear quite poor using a one-year factor for Coors Field. My instinct as to what Colorado’s TBR should look like was informed by my knowledge of the five-year PF that I use.

Now the process is repeated for three more iterations, each time using the most recently calculated value for TBR or TPR as appropriate. The second iteration calculations are:

TBR = [3.593/.978 + 5.913/1.335]*[1 + (.894 - 1)/(16 - 1)]/(2*4.33) = .929

TPR = [4.173/.978 + 4.679/1.335]*[1 + (.929 - 1)/(16 - 1)]/(2*4.33) = .893

Repeating the loop two more times should ensure pretty stable values. Theoretically, there’s nothing to stop you from setting up an infinite loop. I won’t insult your intelligence by spelling the second pair of iterations suggested by Palmer, but the final results for Colorado are a TBR of .929 and a TPR of .993.

So far, all we’ve done is figured teammate-corrected runs ratings for team offense and defense. Our estimate of the park factor remains stuck back at scoring factor. All that’s left now is correcting scoring factor for 1) the teammate factor and 2) the fact that a team plays half its games at home and half on the road. This will require two separate formulas--a batter’s PF (BPF) and a pitcher’s PF (PPF), which are twins in the same way that TBR and TPR are:

BPF = (SF + OPC)/[2*(1 + (TPR - 1)/(T - 1)]

PPF = (SF + OPC)/[2* (1 + (TBR - 1)/(T - 1)]

For Colorado:

BPF = (1.335 + .978)/[2*(1 + (.893 - 1)/(16 - 1)] = 1.165

PPF = (1.335 + .978)/[2*(1 + (.929 - 1)/(16 - 1)] = 1.162

The logic behind the two formulas should be fairly obvious at this point. Again, the multiplication by two in the denominator arises because the two factors in the numerator were not weighted at 50% each. You can write the formulas as:

BPF = (.5*SF + .5*OPC)/[1 + (TPR - 1)/(T - 1)]

PPF = (.5*SF + .5*OPC)/[1 + (TBR - 1)/(T - 1)]

Here, you can see more clearly that the numerator averages the home park factor (SF) and the road park factor (OPC). The numerator could be your final park factor if you wanted to account for road park but didn’t care about teammate effects. The denominator is where the teammate effect is taken into account, and in the same manner as in TBR and TPR. If TPR > 1, BPF goes down because the batters did not benefit from facing the team’s poor pitching. If TBR > 1, PPF goes down pitchers benefitted from not facing their batting teammates.

If one does not care to incorporate the teammate effect, then Palmer’s park factors are pretty much the same as any other intelligently designed park factors. This should not come as a surprise, because as with many implementations of classical sabermetrics, Palmer’s influence is towering. The iterative process used to generate the batting and pitching ratings is pretty clever, and incorporates a real albeit small effect that many of us (myself included) often gloss over.

Tuesday, July 26, 2016

The Willie Davis Method and OPS+ Park Factors

This post is going to lay out the math necessary to apply the so-called "Willie Davis method" of Bill James to his Runs Created and to Base Runs. The last three posts have explained how you can use it with Linear Weights. This is offered in the interest of comprehensiveness, should you decide that you’d like to fiddle with this stuff yourself.

The Willie Davis method as explained by Bill James is based on the most basic RC formula, (H + W)*TB/(AB + W). You could use one of the technical RC versions too, of course, but then you would introduce the problem of what to do with all of the ancillary categories that are included in those versions. A minor modification that would help matters is to give a weight to walks in the B factor (which is simply TB in the basic version), but James has never done that as it would complicate the basic version and mess up all of the neat little RC properties like OBA*SLG*AB = runs.

While I tried to emphasize that I wouldn’t take any of the results from the linear weight translations too seriously, the output of the Willie Davis method is actually used by Sean Forman to calculate OPS+ at baseball-reference.com. So while James used it in the vein that I advocate, Forman uses it to park-adjust the most-looked at total offensive statistic at his site. For this reason, I’ll compare park-adjusted OPS+ figured by his method to what I would do later in the post.

To apply the Willie Davis method to RC, first define a = 1 + W/H, b = TB/H, and outs as AB-H. You also need to calculate New RC, which I will abbreviate as N. That is just regular RC times the adjustment factor you are using (in a park case, if the PF is 1.05 then N is RC*1.05). Then this relationship holds:

N = (a*H)*(b*H)/(a*H + Outs)

This can be manipulated into a quadratic equation:

abH^2 - NaH - N*Outs = 0

And then we can use the quadratic equation to solve for H, which we’ll call H’:

H' = (Na + sqrt((Na)^2 + 4ab(N*Outs)))/(2ab)

The adjustment factor for all of the basic components (S, D, T, HR, W with outs staying fixed) is simply H'/H. So we multiply the positive events by H'/H and the result is a translated batting line.

Since we have applied this type of approach to RC and LW, we might as well do it for Base Runs as well. Allow me to start with this particular BsR equation, published some time ago by David Smyth:

A = S + D + T + W
B = .78S + 2.34D + 3.9T + 2.34HR + .039W
C = AB - H = outs
D = HR

BsR is of course A*B/(B + C) + D, and New BsR (N) is BsR*adjustment factor. To write everything in terms of singles, let’s define a, b, and c (of course, I didn’t realize until after I wrote this that a, b, and c are terrible abbreviations in this case, but I already had them in my spreadsheet and it would have been a real pain to change everything):

a = (S + D + T + W)/S

b = (.78S + 2.34D + 3.9T + 2.34HR + .039W)/S

c = HR/S

Then we need to solve for S' (the new number of singles) in this equation:

aS'*bS'/(bS' + Outs) + cS' = N

This results in a quadratic equation just as the RC approach does, and it can be solved:

S' = (Nb - cOuts + sqrt((cOuts - Nb)^2 + 4(NOuts)(ab + bc)))/(2*(ab + bc))

S'/S is then the multiplier for all of the positive events.

So we have three different approaches based on three different run estimators to accomplish the same task. Which one should be used? Unfortunately, there’s no good empirical way to test these approaches; the entire point of having them is to make estimates of equivalent value under different conditions…i.e. conditions that did not occur in reality.

However, I think it should be self-evident that the quality of the model from which the estimate is derived says a lot about its value. I don’t need to beat that horse again, but it is well-known that Basic RC is not a very good estimator when applied to individuals, which is exactly what we are doing here.

It would also follow that the Linear Weights-based approach should be marginally better than the Base Runs-based approach since BsR should not be applied directly to individuals. Since BsR is better constructed than RC, though, the discrepancies shouldn’t be as bothersome.

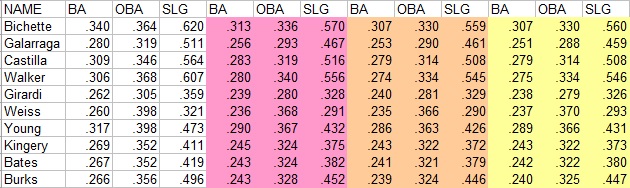
I am going to use the three approaches to derive park-adjusted BA, OBA, and SLG for the 1995 Rockies. In all of the calculations, I am using a 1.23 park factor for Coors Field. The unshaded columns are the players’ raw, unadjusted numbers; the pink columns are adjusted by the RC approach, orange by the ERP approach, and yellow by the BsR approach:


From eyeballing the numbers, I’d say that there is a strong degree of agreement between the ERP and BsR estimates, with the RC estimates as the outliers. As mentioned above, this is along the lines of what I would have expected to see, as both ERP and BsR are better models of the run scoring process than RC. That the ERP and BsR results are close should not come as a surprise, as both estimators give similar weight to each event.

Using RC results in a less severe park adjustment for most players. Why is this? My guess is that it is because RC, with it’s well-known flaw of overvaluing high-end performance, naturally needs to draw down the player’s OBA and SLG less then ERP or BsR to still maintain a high performance. In other words, RC overestimates Larry Walker’s run contribution to begin with, and since the problem only gets worse as OBA and SLG increase, it doesn’t take that that big of a change in OBA or SLG to reduce run value by X%.

As I mentioned earlier, I think it is worth looking at the Willie Davis method closely since some sources (particularly Baseball-Reference) use it for serious things like park-adjusting OPS+. This is in contrast to the position of its creator, Bill James, who presented it more as a toy that yields a rough estimate of what an equal value performance would look like in a different environment.

So, here are the OPS+ figures for the 1995 Rockies figured seven different ways. Let me note off the bat that I am using OBA = (H + W)/(AB + W); for this reason and the fact that I am using my own Coors PF, we should not anticipate exact agreement between these OPS+ results and the ones on Baseball-Reference. The league OBA in the 1995 NL was .328, and SLG was .408, so the basic formula for OPS+ is:

OPS+ = 100*(OBA/.328 + SLG/.408 - 1)

The first column of the table, "unadj" uses the player’s raw stats with no park adjustment. The second column, "trad", reflects the traditional method of figuring OPS+ used by Pete Palmer in The Hidden Game of Baseball, Total Baseball, and the ESPN Baseball Encyclopedia: simply divide OPS+ by the runs park factor (1.23) in this case.

The third column, "sqrt", adjusts OBA and SLG separately by dividing each by the square root of park factor, and uses these adjusted figures in the OPS+ formula above (*). The fourth column, "reg", uses the runs factor to estimate an OPS+ park factor based on a regression equation that relates OPS+ to adjusted runs/out (this is covered in the digression as well).

Finally there are three shaded columns, which use the translated OBA and SLG results from RC, ERP, and BsR respectively as the inputs into the OPS+ equations:


What can we see from this? The traditional approach is more severe than any of the Willie Davis approaches, while the square root approach is a pretty good match for the Willie Davis approaches. Thus, I suggest that the best combination of ease and accuracy in calculating OPS+ is to divide OBA and SLG by the square root of park factor, then plug the adjusted OBA and SLG into the OPS+ equation.

Of course, I should point out that 1995 Coors Field and its 1.23 park factor is one of the most extreme cases in the history of the game. For run of the mill environments, we should expect to see little difference regardless of how the park adjustments are applied, and so I am NOT saying that you should disregard the OPS+ figures on Baseball-Reference (although I do wish that OPS+ would be pushed aside in favor of better comprehensive rate stats). On the other hand, though, I see no reason to use a complicated park adjustment method like the Wille Davis approach when there are much easier approaches which we have some reason to believe better reflect true value.

(*) I shunted some topics down here into a digression because it covers a lot of ground that I’ve covered before and is even drier than what is above. And a lot of sabermetricians are sick and tired of talking about OPS, and I don’t blame them, so just skip this part if you don’t want to rehash it.

As I’ve explained before, OPS+ can be thought of as a quick approximation of runs/out. Some novice sabermetricians are surprised when they discover that OPS+ is adjusted OBA plus adjusted SLG minus one rather than OPS divided by league OPS. And it’s true that the name OPS+ can be misleading, but it is also true that it is a much better metric. One reason is that OPS/LgOPS does not have a 1:1 relationship with runs/out; it has a 2:1 relationship. If a team is 5% above the league average in OPS, your best guess is that they will score 10% more runs. So the OPS/LgOPS ratio has no inherent meaning; to convert it to an estimated unit, you would have to multiply by two and subtract one.

The other reason why OPS+ is superior is that it gives a higher weight to OBA. It doesn’t go far enough--the OBA weight should be something like 1.7 (assuming SLG is weighted at 1), while OPS+ only brings it up to around 1.2--insufficient, but still better than nothing.

Anyway, if you run a regression to estimate adjusted runs/out from OPS+, you find that it’s pretty close to a 1:1 relationship, particularly if you include HB in your OBA. I haven’t though, and so the relationship is something like 1.06(OPS+) - .06 = adjusted runs/out (again, it should be very close to 1:1 if you calculate OPS+ like a non-lazy person). The "reg" park adjustment, then, is to substitute the park factor for adjusted runs/out and solve for OPS+, giving an OPS+ park factor:

OPS+ park factor = (runs park factor + .06)/1.06

The slope of the line relating OPS+ to runs/out is not particularly steep, and so this is an almost negligible adjustment--for Coors Field and its 1.23 run park factor, we get a 1.217 OPS+ park factor.

Now a word about the traditional runs factor v. the individual square root adjustments. Since OPS+ is being used as a stand-in for run creation relative to the league average, I would assume that the goal in choosing a park adjustment approach is to provide the best match between adjusted OPS+ and adjusted runs/out. It turns out that if you figure relative ERP/Out for the ’95 Rockies players, the results are fairly consistent with the ERP/BsR translated OPS+. Thus, I am going to assume that those are the “best” adjusted OPS+ results, and that any simple park adjustment approach should hope to approximate them.

As a consequence, the square root adjustments to OBA and SLG look the best. Why is this? I’m not exactly sure; one might think that since OPS+ is a stand-in for relative runs/out, we should expect that the best adjustment approach once we already have unadjusted OPS+ is to divide by park factor. Yet we can get better results by adjusting each component individually by the square root of PF. OPS+ is far from a perfect approximation of relative runs/out, though, so it may not be that surprising that applying OPS+ logic to park factors is not quite optimal either.

Interestingly, the justification for the square root adjustment can be seen by looking at Runs Created in its OBA*SLG form. While OBA*SLG gives you an estimate of runs/at bat, not runs/out, it is of course related. If you take OBA/sqrt(PF)*SLG/sqrt(PF) you get OBA*SLG/(sqrt(PF)*sqrt(PF)) = OBA*SLG/PF

It is quite possible that there is a different power you could raise PF to that would provide a better match for our ERP-based OPS+ estimates, but getting any more in-depth would defeat the purpose of having a crude tool. In fact, I think that adjusting OPS+ by the Willie Davis method goes too far as well. Regardless, I would be remiss if I didn’t again emphasize that the 1995 Rockies are an extreme case, and so while the differences between the approaches may appear to be significant, they really aren’t 99% of the time.

Saturday, October 05, 2013

2013 Park Factors

Unfortunately I do not have time right now to run my full end of season stats report (I will be doing it, but it will have to wait for November). However, since the park factors are the element that generates by the far the most interest (as in twenty people are interested rather than five), I wanted to get them posted in a reasonably timely fashion.

For an explanation of the calculations, see the overall explanatory post from last year . This year I did include five-year park factors for San Diego and Seattle due to the outfield dimension changes in this park. My usual approach, which is not optimal but is simple to implement (particularly when figuring historical park factors), is to treat any park with dimension changes as a new park. One could also weight the current year more heavily but still consider prior years or take some other approach, but all I’ve done in this case is provide the five-year park factors as well, listed on the table as SD-5 and SEA-5. In the case of Petco, the one-year factor is .95 and the five-year factor is .92. The difference in the Safeco factors is more extreme--1.00 for one year, .94 for five years.

2013 Park Factors

Wednesday, October 10, 2012

End of Season Statistics 2012

The spreadsheets are published as Google Spreadsheets, which you can download in Excel format by changing the extension in the address from "=html" to "=xls". That way you can download them and manipulate things however you see fit. The player spreadsheets are not ready yet, but I want to get the team stuff posted.

The data comes from a number of different sources. Most of the basic data comes from Doug's Stats, which is a very handy site, or Baseball-Reference. KJOK's park database provided some of the data used in the park factors, but for recent seasons park data comes from B-R. Data on pitcher's batted ball types allowed, doubles/triples allowed, and inherited/bequeathed runners comes from Baseball Prospectus.

The basic philosophy behind these stats is to use the simplest methods that have acceptable accuracy. Of course, "acceptable" is in the eye of the beholder, namely me. I use Pythagenpat not because other run/win converters, like a constant RPW or a fixed exponent are not accurate enough for this purpose, but because it's mine and it would be kind of odd if I didn't use it.

If I seem to be a stickler for purity in my critiques of others' methods, I'd contend it is usually in a theoretical sense, not an input sense. So when I exclude hit batters, I'm not saying that hit batters are worthless or that they *should* be ignored; it's just easier not to mess with them and not that much less accurate.

I also don't really have a problem with people using sub-standard methods (say, Basic RC) as long as they acknowledge that they are sub-standard. If someone pretends that Basic RC doesn't undervalue walks or cause problems when applied to extreme individuals, I'll call them on it; if they explain its shortcomings but use it regardless, I accept that. Take these last three paragraphs as my acknowledgment that some of the statistics displayed here have shortcomings as well.

The League spreadsheet is pretty straightforward--it includes league totals and averages for a number of categories, most or all of which are explained at appropriate junctures throughout this piece. The advent of interleague play has created two different sets of league totals--one for the offense of league teams and one for the defense of league teams. Before interleague play, these two were identical. I do not present both sets of totals (you can figure the defensive ones yourself from the team spreadsheet, if you desire), just those for the offenses. The exception is for the defense-specific statistics, like innings pitched and quality starts. The figures for those categories in the league report are for the defenses of the league's teams. However, I do include each league's breakdown of basic pitching stats between starters and relievers (denoted by "s" or "r" prefixes), and so summing those will yield the totals from the pitching side. The one abbreviation you might not recognize is "N"--this is the league average of runs/game for one team, and it will pop up again.

The Team spreadsheet focuses on overall team performance--wins, losses, runs scored, runs allowed. The columns included are: Park Factor (PF), Home Run Park Factor (PFhr), Winning Percentage (W%), Expected W% (EW%), Predicted W% (PW%), wins, losses, runs, runs allowed, Runs Created (RC), Runs Created Allowed (RCA), Home Winning Percentage (HW%), Road Winning Percentage (RW%) [exactly what they sound like--W% at home and on the road], Runs/Game (R/G), Runs Allowed/Game (RA/G), Runs Created/Game (RCG), Runs Created Allowed/Game (RCAG), and Runs Per Game (the average number of runs scored an allowed per game). Ideally, I would use outs as the denominator, but for teams, outs and games are so closely related that I don’t think it’s worth the extra effort.

The runs and Runs Created figures are unadjusted, but the per-game averages are park-adjusted, except for RPG which is also raw. Runs Created and Runs Created Allowed are both based on a simple Base Runs formula. The formula is:

A = H + W - HR - CS
B = (2TB - H - 4HR + .05W + 1.5SB)*.76
C = AB - H
D = HR
Naturally, A*B/(B + C) + D.

I have explained the methodology used to figure the PFs before, but the cliff’s notes version is that they are based on five years of data when applicable, include both runs scored and allowed, and they are regressed towards average (PF = 1), with the amount of regression varying based on the number of years of data used. There are factors for both runs and home runs. The initial PF (not shown) is:

iPF = (H*T/(R*(T - 1) + H) + 1)/2
where H = RPG in home games, R = RPG in road games, T = # teams in league (14 for AL and 16 for NL). Then the iPF is converted to the PF by taking x*iPF + (1-x), where x = .6 if one year of data is used, .7 for 2, .8 for 3, and .9 for 4+.

It is important to note, since there always seems to be confusion about this, that these park factors already incorporate the fact that the average player plays 50% on the road and 50% at home. That is what the adding one and dividing by 2 in the iPF is all about. So if I list Fenway Park with a 1.02 PF, that means that it actually increases RPG by 4%.

In the calculation of the PFs, I did not get picky and take out “home” games that were actually at neutral sites, like the Astros/Cubs series that was moved to Milwaukee in 2008. I have also reset the NYN park factor due to park modifications; only 2012 data for the Mets is being considered.

There are also Team Offense and Defense spreadsheets. These include the following categories:

Team offense: Plate Appearances, Batting Average (BA), On Base Average (OBA), Slugging Average (SLG), Secondary Average (SEC), Walks per At Bat (WAB), Isolated Power (SLG - BA), R/G at home (hR/G), and R/G on the road (rR/G) BA, OBA, SLG, WAB, and ISO are park-adjusted by dividing by the square root of park factor (or the equivalent; WAB = (OBA - BA)/(1 - OBA) and ISO = SLG - BA).

Team defense: Innings Pitched, BA, OBA, SLG, Innings per Start (IP/S), Starter's eRA (seRA), Reliever's eRA (reRA), Quality Start Percentage (QS%), RA/G at home (hRA/G), RA/G on the road (rRA/G), Battery Mishap Rate (BMR), Modified Fielding Average (mFA), and Defensive Efficiency Record (DER). BA, OBA, and SLG are park-adjusted by dividing by the square root of PF; seRA and reRA are divided by PF.

The three fielding metrics I've included are limited it only to metrics that a) I can calculate myself and b) are based on the basic available data, not specialized PBP data. The three metrics are explained in this post, but here are quick descriptions of each:

1) BMR--wild pitches and passed balls per 100 baserunners = (WP + PB)/(H + W - HR)*100

2) mFA--fielding average removing strikeouts and assists = (PO - K)/(PO - K + E)

3) DER--the Bill James classic, using only the PA-based estimate of plays made. Based on a suggestion by Terpsfan101, I've tweaked the error coefficient. Plays Made = PA - K - H - W - HR - HB - .64E and DER = PM/(PM + H - HR + .64E)

Next are the individual player reports. I defined a starting pitcher as one with 15 or more starts. All other pitchers are eligible to be included as a reliever. If a pitcher has 40 appearances, then they are included. Additionally, if a pitcher has 50 innings and less than 50% of his appearances are starts, he is also included as a reliever (this allows some swingmen type pitchers who wouldn’t meet either the minimum start or appearance standards to get in).

For all of the player reports, ages are based on simply subtracting their year of birth from 2011. I realize that this is not compatible with how ages are usually listed and so “Age 27” doesn’t necessarily correspond to age 27 as I list it, but it makes everything a heckuva lot easier, and I am more interested in comparing the ages of the players to their contemporaries, for which case it makes very little difference. The "R" category records rookie status with a "R" for rookies and a blank for everyone else; I've trusted Baseball Prospectus on this. Also, all players are counted as being on the team with whom they played/pitched (IP or PA as appropriate) the most.

For relievers, the categories listed are: Games, Innings Pitched, estimated Plate Appearances (PA), Run Average (RA), Relief Run Average (RRA), Earned Run Average (ERA), Estimated Run Average (eRA), DIPS Run Average (dRA), Strikeouts per Game (KG), Walks per Game (WG), Guess-Future (G-F), Inherited Runners per Game (IR/G), Batting Average on Balls in Play (%H), Runs Above Average (RAA), and Runs Above Replacement (RAR).

IR/G is per relief appearance (G - GS); it is an interesting thing to look at, I think, in lieu of actual leverage data. You can see which closers come in with runners on base, and which are used nearly exclusively to start innings. Of course, you can’t infer too much; there are bad relievers who come in with a lot of people on base, not because they are being used in high leverage situations, but because they are long men being used in low-leverage situations already out of hand.

For starting pitchers, the columns are: Wins, Losses, Innings Pitched, Estimated Plate Appearances (PA), RA, RRA, ERA, eRA, dRA, KG, WG, G-F, %H, Pitches/Start (P/S), Quality Start Percentage (QS%), RAA, and RAR. RA and ERA you know--R*9/IP or ER*9/IP, park-adjusted by dividing by PF. The formulas for eRA and dRA are based on the same Base Runs equation and they estimate RA, not ERA.

* eRA is based on the actual results allowed by the pitcher (hits, doubles, home runs, walks, strikeouts, etc.). It is park-adjusted by dividing by PF.

* dRA is the classic DIPS-style RA, assuming that the pitcher allows a league average %H, and that his hits in play have a league-average S/D/T split. It is park-adjusted by dividing by PF.

The formula for eRA is:

A = H + W - HR
B = (2*TB - H - 4*HR + .05*W)*.78
C = AB - H = K + (3*IP - K)*x (where x is figured as described below for PA estimation and is typically around .93) = PA (from below) - H - W
eRA = (A*B/(B + C) + HR)*9/IP

To figure dRA, you first need the estimate of PA described below. Then you calculate W, K, and HR per PA (call these %W, %K, and %HR). Percentage of balls in play (BIP%) = 1 - %W - %K - %HR. This is used to calculate the DIPS-friendly estimate of %H (H per PA) as e%H = Lg%H*BIP%.

Now everything has a common denominator of PA, so we can plug into Base Runs:

A = e%H + %W
B = (2*(z*e%H + 4*%HR) - e%H - 5*%HR + .05*%W)*.78
C = 1 - e%H - %W - %HR
cRA = (A*B/(B + C) + %HR)/C*a

z is the league average of total bases per non-HR hit (TB - 4*HR)/(H - HR), and a is the league average of (AB - H) per game.

In the past couple years I’ve presented a couple of batted ball RA estimates. I’ve removed these this year, not just because batted ball data exhibits questionable reliability but because these metrics were complicated to figure, required me to collate the batted ball data, and were not personally useful to me. I figure these stats for my own enjoyment and have in some form or another going back to 1997. I share them here only because I would do it anyway, so if I’m not interested in certain categories, there’s no reason to keep presenting them.

Instead, I’m showing strikeout and walk rate, both expressed as per game. By game I mean not 9 innings but rather the league average of PA/G. I have always been a proponent of using PA and not IP as the denominator for non-run pitching rates, and now the use of per PA rates is widespread. Usually these are expressed as K/PA and W/PA, or equivalently, percentage of PA with a strikeout or walk. I don’t believe that any site publishes these as K and W per equivalent game as I am here. This is not better than K%--it’s simply applying a scalar multiplier. I like it because it generally follows the same scale as the familiar K/9.

To facilitate this, I’ve finally corrected a flaw in the formula I use to estimate plate appearances for pitchers. Previously, I’ve done it the lazy way by not splitting strikeouts out from other outs. I am now using this formula to estimate PA (where PA = AB + W):

PA = K + (3*IP - K)*x + H + W
Where x = league average of (AB - H - K)/(3*IP - K)

Then KG = K*Lg(PA/G) and WG = W*Lg(PA/G).

G-F is a junk stat, included here out of habit because I've been including it for years. It was intended to give a quick read of a pitcher's expected performance in the next season, based on eRA and strikeout rate. Although the numbers vaguely resemble RAs, it's actually unitless. As a rule of thumb, anything under four is pretty good for a starter. G-F = 4.46 + .095(eRA) - .113(K*9/IP). It is a junk stat. JUNK STAT JUNK STAT JUNK STAT. Got it?

%H is BABIP, more or less--%H = (H - HR)/(PA - HR - K - W), where PA was estimated above. Pitches/Start includes all appearances, so I've counted relief appearances as one-half of a start (P/S = Pitches/(.5*G + .5*GS). QS% is just QS/(G - GS); I don't think it's particularly useful, but Doug's Stats include QS so I include it.

I've used a stat called Relief Run Average (RRA) in the past, based on Sky Andrecheck's article in the August 1999 By the Numbers; that one only used inherited runners, but I've revised it to include bequeathed runners as well, making it equally applicable to starters and relievers. I am using RRA as the building block for baselined value estimates for all pitchers this year. I explained RRA in this article , but the bottom line formulas are:

BRSV = BRS - BR*i*sqrt(PF)
IRSV = IR*i*sqrt(PF) - IRS
RRA = ((R - (BRSV + IRSV))*9/IP)/PF

The two baselined stats are Runs Above Average (RAA) and Runs Above Replacement (RAR). RAA uses the league average runs/game (N) for both starters and relievers, while RAR uses separate replacement levels for starters and relievers. Thus, RAA and RAR will be pretty close for relievers:

RAA = (N - RRA)*IP/9
RAR (relievers) = (1.11*N - RRA)*IP/9
RAR (starters) = (1.28*N - RRA)*IP/9

All players with 300 or more plate appearances are included in the Hitters spreadsheets (along with some players close to the cutoff point who I was interested in). Each is assigned one position, the one at which they appeared in the most games. The statistics presented are: Games played (G), Plate Appearances (PA), Outs (O), Batting Average (BA), On Base Average (OBA), Slugging Average (SLG), Secondary Average (SEC), Runs Created (RC), Runs Created per Game (RG), Speed Score (SS), Hitting Runs Above Average (HRAA), Runs Above Average (RAA), Hitting Runs Above Replacement (HRAR), and Runs Above Replacement (RAR).

I do not bother to include hit batters, so take note of that for players who do get plunked a lot. Therefore, PA are simply AB + W. Outs are AB - H + CS. BA and SLG you know, but remember that without HB and SF, OBA is just (H + W)/(AB + W). Secondary Average = (TB - H + W)/AB = SLG - BA + (OBA - BA)/(1 - OBA). I have not included net steals as many people (and Bill James himself) do--it is solely hitting events.

BA, OBA, and SLG are park-adjusted by dividing by the square root of PF. This is an approximation, of course, but I'm satisfied that it works well. The goal here is to adjust for the win value of offensive events, not to quantify the exact park effect on the given rate. I use the BA/OBA/SLG-based formula to figure SEC, so it is park-adjusted as well.

Runs Created is actually Paul Johnson's ERP, more or less. Ideally, I would use a custom linear weights formula for the given league, but ERP is just so darn simple and close to the mark that it’s hard to pass up. I still use the term “RC” partially as a homage to Bill James (seriously, I really like and respect him even if I’ve said negative things about RC and Win Shares), and also because it is just a good term. I like the thought put in your head when you hear “creating” a run better than “producing”, “manufacturing”, “generating”, etc. to say nothing of names like “equivalent” or “extrapolated” runs. None of that is said to put down the creators of those methods--there just aren’t a lot of good, unique names available. Anyway, RC = (TB + .8H + W + .7SB - CS - .3AB)*.322.

RC is park adjusted by dividing by PF, making all of the value stats that follow park adjusted as well. RG, the rate, is RC/O*25.5. I do not believe that outs are the proper denominator for an individual rate stat, but I also do not believe that the distortions caused are that bad. (I still intend to finish my rate stat series and discuss all of the options in excruciating detail, but alas you’ll have to take my word for it now).

I have decided to switch to a watered-down version of Bill James' Speed Score this year; I only use four of his categories. Previously I used my own knockoff version called Speed Unit, but trying to keep it from breaking down every few years was a wasted effort.

Speed Score is the average of four components, which I'll call a, b, c, and d:

a = ((SB + 3)/(SB + CS + 7) - .4)*20
b = sqrt((SB + CS)/(S + W))*14.3
c = ((R - HR)/(H + W - HR) - .1)*25
d = T/(AB - HR - K)*450

James actually uses a sliding scale for the triples component, but it strikes me as needlessly complex and so I've streamlined it. I also changed some of his division to mathematically equivalent multiplications.

There are a whopping four categories that compare to a baseline; two for average, two for replacement. Hitting RAA compares to a league average hitter; it is in the vein of Pete Palmer’s Batting Runs. RAA compares to an average hitter at the player’s primary position. Hitting RAR compares to a “replacement level” hitter; RAR compares to a replacement level hitter at the player’s primary position. The formulas are:

HRAA = (RG - N)*O/25.5
RAA = (RG - N*PADJ)*O/25.5
HRAR = (RG - .73*N)*O/25.5
RAR = (RG - .73*N*PADJ)*O/25.5

PADJ is the position adjustment, and it is based on 2002-2011 offensive data. For catchers it is .89; for 1B/DH, 1.17; for 2B, .97; for 3B, 1.03; for SS, .93; for LF/RF, 1.13; and for CF, 1.02. I had been using the 1992-2001 data as a basis for the last ten years, but finally have done an update. I’m a little hesitant about this update, as the middle infield positions are the biggest movers (higher positional adjustments, meaning less positional credit). I have no qualms for second base, but the shortstop PADJ is out of line with the other position adjustments widely in use and feels a bit high to me. But there are some decent points to be made in favor of offensive adjustments, and I’ll have a bit more on this topic in general below.

That was the mechanics of the calculations; now I'll twist myself into knots trying to justify them. If you only care about the how and not the why, stop reading now.

The first thing that should be covered is the philosophical position behind the statistics posted here. They fall on the continuum of ability and value in what I have called "performance". Performance is a technical-sounding way of saying "Whatever arbitrary combination of ability and value I prefer".

With respect to park adjustments, I am not interested in how any particular player is affected, so there is no separate adjustment for lefties and righties for instance. The park factor is an attempt to determine how the park affects run scoring rates, and thus the win value of runs.

I apply the park factor directly to the player's statistics, but it could also be applied to the league context. The advantage to doing it my way is that it allows you to compare the component statistics (like Runs Created or OBA) on a park-adjusted basis. The drawback is that it creates a new theoretical universe, one in which all parks are equal, rather than leaving the player grounded in the actual context in which he played and evaluating how that context (and not the player's statistics) was altered by the park.

The good news is that the two approaches are essentially equivalent; in fact, they are equivalent if you assume that the Runs Per Win factor is equal to the RPG. Suppose that we have a player in an extreme park (PF = 1.15, approximately like Coors Field pre-humidor) who has an 8 RG before adjusting for park, while making 350 outs in a 4.5 N league. The first method of park adjustment, the one I use, converts his value into a neutral park, so his RG is now 8/1.15 = 6.957. We can now compare him directly to the league average:

RAA = (6.957 - 4.5)*350/25.5 = +33.72

The second method would be to adjust the league context. If N = 4.5, then the average player in this park will create 4.5*1.15 = 5.175 runs. Now, to figure RAA, we can use the unadjusted RG of 8:

RAA = (8 - 5.175)*350/25.5 = +38.77

These are not the same, as you can obviously see. The reason for this is that they take place in two different contexts. The first figure is in a 9 RPG (2*4.5) context; the second figure is in a 10.35 RPG (2*4.5*1.15) context. Runs have different values in different contexts; that is why we have RPW converters in the first place. If we convert to WAA (using RPW = RPG, which is only an approximation, so it's usually not as tidy as it appears below), then we have:

WAA = 33.72/9 = +3.75
WAA = 38.77/10.35 = +3.75

Once you convert to wins, the two approaches are equivalent. The other nice thing about the first approach is that once you park-adjust, everyone in the league is in the same context, and you can dispense with the need for converting to wins at all. You still might want to convert to wins, and you'll need to do so if you are comparing the 2010 players to players from other league-seasons (including between the AL and NL in the same year), but if you are only looking to compare Jose Bautista to Miguel Cabrera, it's not necessary. WAR is somewhat ubiquitous now, but personally I prefer runs when possible--why mess with decimal points if you don't have to?

The park factors used to adjust player stats here are run-based. Thus, they make no effort to project what a player "would have done" in a neutral park, or account for the difference effects parks have on specific events (walks, home runs, BA) or types of players. They simply account for the difference in run environment that is caused by the park (as best I can measure it). As such, they don't evaluate a player within the actual run context of his team's games; they attempt to restate the player's performance as an equivalent performance in a neutral park.

I suppose I should also justify the use of sqrt(PF) for adjusting component statistics. The classic defense given for this approach relies on basic Runs Created--runs are proportional to OBA*SLG, and OBA*SLG/PF = OBA/sqrt(PF)*SLG/sqrt(PF). While RC may be an antiquated tool, you will find that the square root adjustment is fairly compatible with linear weights or Base Runs as well. I am not going to take the space to demonstrate this claim here, but I will some time in the future.

Many value figures published around the sabersphere adjust for the difference in quality level between the AL and NL. I don't, but this is a thorny area where there is no right or wrong answer as far as I'm concerned. I also do not make an adjustment in the league averages for the fact that the overall NL averages include pitcher batting and the AL does not (not quite true in the era of interleague play, but you get my drift).

The difference between the leagues may not be precisely calculable, and it certainly is not constant, but it is real. If the average player in the AL is better than the average player in the NL, it is perfectly reasonable to expect the average AL player to have more RAR than the average NL player, and that will not happen without some type of adjustment. On the other hand, if you are only interested in evaluating a player relative to his own league, such an adjustment is not necessarily welcome.

The league argument only applies cleanly to metrics baselined to average. Since replacement level compares the given player to a theoretical player that can be acquired on the cheap, the same pool of potential replacement players should by definition be available to the teams of each league. One could argue that if the two leagues don't have equal talent at the major league level, they might not have equal access to replacement level talent--except such an argument is at odds with the notion that replacement level represents talent that is truly "freely available".

So it's hard to justify the approach I take, which is to set replacement level relative to the average runs scored in each league, with no adjustment for the difference in the leagues. The best justification is that it's simple and it treats each league as its own universe, even if in reality they are connected.

The replacement levels I have used here are very much in line with the values used by other sabermetricians. This is based both on my own "research", my interpretation of other's people research, and a desire to not stray from consensus and make the values unhelpful to the majority of people who may encounter them.

Replacement level is certainly not settled science. There is always going to be room to disagree on what the baseline should be. Even if you agree it should be "replacement level", any estimate of where it should be set is just that--an estimate. Average is clean and fairly straightforward, even if its utility is questionable; replacement level is inherently messy. So I offer the average baseline as well.

For position players, replacement level is set at 73% of the positional average RG (since there's a history of discussing replacement level in terms of winning percentages, this is roughly equivalent to .350). For starting pitchers, it is set at 128% of the league average RA (.380), and for relievers it is set at 111% (.450).

I am still using an analytical structure that makes the comparison to replacement level for a position player by applying it to his hitting statistics. This is the approach taken by Keith Woolner in VORP (and some other earlier replacement level implementations), but the newer metrics (among them Rally and Fangraphs' WAR) handle replacement level by subtracting a set number of runs from the player's total runs above average in a number of different areas (batting, fielding, baserunning, positional value, etc.), which for lack of a better term I will call the subtraction approach.

The offensive positional adjustment makes the inherent assumption that the average player at each position is equally valuable. I think that this is close to being true, but it is not quite true. The ideal approach would be to use a defensive positional adjustment, since the real difference between a first baseman and a shortstop is their defensive value. When you bat, all runs count the same, whether you create them as a first baseman or as a shortstop.

That being said, using "replacement hitter at position" does not cause too many distortions. It is not theoretically correct, but it is practically powerful. For one thing, most players, even those at key defensive positions, are chosen first and foremost for their offense. Empirical work by Keith Woolner has shown that the replacement level hitting performance is about the same for every position, relative to the positional average.

Figuring what the defensive positional adjustment should be, though, is easier said than done. Therefore, I use the offensive positional adjustment. So if you want to criticize that choice, or criticize the numbers that result, be my guest. But do not claim that I am holding this up as the correct analytical structure. I am holding it up as the most simple and straightforward structure that conforms to reality reasonably well, and because while the numbers may be flawed, they are at least based on an objective formula that I can figure myself. If you feel comfortable with some other assumptions, please feel free to ignore mine.

That still does not justify the use of HRAR--hitting runs above replacement--which compares each hitter, regardless of position, to 73% of the league average. Basically, this is just a way to give an overall measure of offensive production without regard for position with a low baseline. It doesn't have any real baseball meaning.

A player who creates runs at 90% of the league average could be above-average (if he's a shortstop or catcher, or a great fielder at a less important fielding position), or sub-replacement level (DHs that create 4 runs a game are not valuable properties). Every player is chosen because his total value, both hitting and fielding, is sufficient to justify his inclusion on the team. HRAR fails even if you try to justify it with a thought experiment about a world in which defense doesn't matter, because in that case the absolute replacement level (in terms of RG, without accounting for the league average) would be much higher than it is currently.

The specific positional adjustments I use are based on 1992-2001 data. There's no particular reason for not updating them; at the time I started using them, they represented the ten most recent years. I have stuck with them because I have not seen compelling evidence of a change in the degree of difficulty or scarcity between the positions between now and then, and because I think they are fairly reasonable. The positions for which they diverge the most from the defensive position adjustments in common use are 2B, 3B, and CF. Second base is considered a premium position by the offensive PADJ (.94), while third base and center field are both neutral (1.01 and 1.02).

Another flaw is that the PADJ is applied to the overall league average RG, which is artificially low for the NL because of pitcher's batting. When using the actual league average runs/game, it's tough to just remove pitchers--any adjustment would be an estimate. If you use the league total of runs created instead, it is a much easier fix.

One other note on this topic is that since the offensive PADJ is a proxy for average defensive value by position, ideally it would be applied by tying it to defensive playing time. I have done it by outs, though.

The reason I have taken this flawed path is because 1) it ties the position adjustment directly into the RAR formula rather then leaving it as something to subtract on the outside and more importantly 2) there’s no straightforward way to do it. The best would be to use defensive innings--set the full-time player to X defensive innings, figure how Derek Jeter’s innings compared to X, and adjust his PADJ accordingly. Games in the field or games played are dicey because they can cause distortion for defensive replacements. Plate Appearances avoid the problem that outs have of being highly related to player quality, but they still carry the illogic of basing it on offensive playing time. And of course the differences here are going to be fairly small (a few runs). That is not to say that this way is preferable, but it’s not horrible either, at least as far as I can tell.

To compare this approach to the subtraction approach, start by assuming that a replacement level shortstop would create .86*.73*4.5 = 2.825 RG (or would perform at an overall level of equivalent value to being an average fielder at shortstop while creating 2.825 runs per game). Suppose that we are comparing two shortstops, each of whom compiled 600 PA and played an equal number of defensive games and innings (and thus would have the same positional adjustment using the subtraction approach). Alpha made 380 outs and Bravo made 410 outs, and each ranked as dead-on average in the field.

The difference in overall RAR between the two using the subtraction approach would be equal to the difference between their offensive RAA compared to the league average. Assuming the league average is 4.5 runs, and that both Alpha and Bravo created 75 runs, their offensive RAAs are:

Alpha = (75*25.5/380 - 4.5)*380/25.5 = +7.94

Similarly, Bravo is at +2.65, and so the difference between them will be 5.29 RAR.

Using the flawed approach, Alpha's RAR will be:

(75*25.5/380 - 4.5*.73*.86)*380/25.5 = +32.90

Bravo's RAR will be +29.58, a difference of 3.32 RAR, which is two runs off of the difference using the subtraction approach.

The downside to using PA is that you really need to consider park effects if you, whereas outs allow you to sidestep park effects. Outs are constant; plate appearances are linked to OBA. Thus, they not only depend on the offensive context (including park factor), but also on the quality of one's team. Of course, attempting to adjust for team PA differences opens a huge can of worms which is not really relevant; for now, the point is that using outs for individual players causes distortions, sometimes trivial and sometimes bothersome, but almost always makes one's life easier.

I do not include fielding (or baserunning outside of steals, although that is a trivial consideration in comparison) in the RAR figures--they cover offense and positional value only). This in no way means that I do not believe that fielding is an important consideration in player valuation. However, two of the key principles of these stat reports are 1) not incorporating any data that is not readily available and 2) not simply including other people's results (of course I borrow heavily from other people's methods, but only adapting methodology that I can apply myself).

Any fielding metric worth its salt will fail to meet either criterion--they use zone data or play-by-play data which I do not have easy access to. I do not have a fielding metric that I have stapled together myself, and so I would have to simply lift other analysts' figures.

Setting the practical reason for not including fielding aside, I do have some reservations about lumping fielding and hitting value together in one number because of the obvious differences in reliability between offensive and fielding metrics. In theory, they absolutely should be put together. But in practice, I believe it would be better to regress the fielding metric to a point at which it would be roughly equivalent in reliability to the offensive metric.

Offensive metrics have error bars associated with them, too, of course, and in evaluating a single season's value, I don't care about the vagaries that we often lump together as "luck". Still, there are errors in our assessment of linear weight values and players that collect an unusual proportion of infield hits or hits to the left side, errors in estimation of park factor, and any number of other factors that make their events more or less valuable than an average event of that type.

Fielding metrics offer up all of that and more, as we cannot be nearly as certain of true successes and failures as we are when analyzing offense. Recent investigations, particularly by Colin Wyers, have raised even more questions about the level of uncertainty. So, even if I was including a fielding value, my approach would be to assume that the offensive value was 100% reliable (which it isn't), and regress the fielding metric relative to that (so if the offensive metric was actually 70% reliable, and the fielding metric 40% reliable, I'd treat the fielding metric as .4/.7 = 57% reliable when tacking it on, to illustrate with a simplified and completely made up example presuming that one could have a precise estimate of nebulous "reliability").

Given the inherent assumption of the offensive PADJ that all positions are equally valuable, once RAR has been figured for a player, fielding value can be accounted for by adding on his runs above average relative to a player at his own position. If there is a shortstop that is -2 runs defensively versus an average shortstop, he is without a doubt a plus defensive player, and a more valuable defensive player than a first baseman who was +1 run better than an average first baseman. Regardless, since it was implicitly assumed that they are both average defensively for their position when RAR was calculated, the shortstop will see his value docked two runs. This DOES NOT MEAN that the shortstop has been penalized for his defense. The whole process of accounting for positional differences, going from hitting RAR to positional RAR, has benefited him.

I've found that there is often confusion about the treatment of first baseman and designated hitters in my PADJ methodology, since I consider DHs as in the same pool as first baseman. The fact of the matter is that first baseman outhit DH. There is any number of potential explanations for this; DHs are often old or injured, players hit worse when DHing than they do when playing the field, etc. This actually helps first baseman, since the DHs drag the average production of the pool down, thus resulting in a lower replacement level than I would get if I considered first baseman alone.

However, this method does assume that a 1B and a DH have equal defensive value. Obviously, a DH has no defensive value. What I advocate to correct this is to treat a DH as a bad defensive first baseman, and thus knock another five or ten runs off of his RAR for a full-time player. I do not incorporate this into the published numbers, but you should keep it in mind. However, there is no need to adjust the figures for first baseman upwards --the only necessary adjustment is to take the DHs down a notch.

Finally, I consider each player at his primary defensive position (defined as where he appears in the most games), and do not weight the PADJ by playing time. This does shortchange a player like Ben Zobrist (who saw significant time at a tougher position than his primary position), and unduly boost a player like Joe Mauer (who logged a lot of games at a much easier position than his primary position). For most players, though, it doesn't matter much. I find it preferable to make manual adjustments for the unusual cases rather than add another layer of complexity to the whole endeavor.

2012 Leagues

2012 Park Factors

2012 Teams

2012 Team Offense

2012 Team Defense

2012 AL Relievers

2012 NL Relievers

2012 AL Starters

2012 NL Starters

2012 AL Hitters

2012 NL Hitters

Sunday, October 02, 2011

End of Season Statistics 2011

The spreadsheets are published as Google Spreadsheets, which you can download in Excel format by changing the extension in the address from "=html" to "=xls". That way you can download them and manipulate things however you see fit.

The data comes from a number of different sources. Most of the basic data comes from Doug's Stats, which is a very handy site. KJOK's park database provided some of the data used in the park factors, but for recent seasons park data comes from anywhere that has it--Doug's Stats, or Baseball-Reference, or ESPN.com, or MLB.com. Data on pitcher's batted ball types allowed, doubles/triples allowed, and inherited/bequeathed runners comes from Baseball Prospectus.

The basic philosophy behind these stats is to use the simplest methods that have acceptable accuracy. Of course, "acceptable" is in the eye of the beholder, namely me. I use Pythagenpat not because other run/win converters, like a constant RPW or a fixed exponent are not accurate enough for this purpose, but because it's mine and it would be kind of odd if I didn't use it.

If I seem to be a stickler for purity in my critiques of others' methods, I'd contend it is usually in a theoretical sense, not an input sense. So when I exclude hit batters, I'm not saying that hit batters are worthless or that they *should* be ignored; it's just easier not to mess with them and not that much less accurate.

I also don't really have a problem with people using sub-standard methods (say, Basic RC) as long as they acknowledge that they are sub-standard. If someone pretends that Basic RC doesn't undervalue walks or cause problems when applied to extreme individuals, I'll call them on it; if they explain its shortcomings but use it regardless, I accept that. Take these last three paragraphs as my acknowledgment that some of the statistics displayed here have shortcomings as well.

The League spreadsheet is pretty straightforward--it includes league totals and averages for a number of categories, most or all of which are explained at appropriate junctures throughout this piece. The advent of interleague play has created two different sets of league totals--one for the offense of league teams and one for the defense of league teams. Before interleague play, these two were identical. I do not present both sets of totals (you can figure the defensive ones yourself from the team spreadsheet, if you desire), just those for the offenses. The exception is for the defense-specific statistics, like innings pitched and quality starts. The figures for those categories in the league report are for the defenses of the league's teams. However, I do include each league's breakdown of basic pitching stats between starters and relievers (denoted by "s" or "r" prefixes), and so summing those will yield the totals from the pitching side. The one abbreviation you might not recognize is "N"--this is the league average of runs/game for one team, and it will pop up again.

The Team spreadsheet focuses on overall team performance--wins, losses, runs scored, runs allowed. The columns included are: Park Factor (PF), Home Run Park Factor (PFhr), Winning Percentage (W%), Expected W% (EW%), Predicted W% (PW%), wins, losses, runs, runs allowed, Runs Created (RC), Runs Created Allowed (RCA), Home Winning Percentage (HW%), Road Winning Percentage (RW%) [exactly what they sound like--W% at home and on the road], Runs/Game (R/G), Runs Allowed/Game (RA/G), Runs Created/Game (RCG), Runs Created Allowed/Game (RCAG), and Runs Per Game (the average number of runs scored an allowed per game). Ideally, I would use outs as the denominator, but for teams, outs and games are so closely related that I don’t think it’s worth the extra effort.

The runs and Runs Created figures are unadjusted, but the per-game averages are park-adjusted, except for RPG which is also raw. Runs Created and Runs Created Allowed are both based on a simple Base Runs formula. The formula is:

A = H + W - HR - CS
B = (2TB - H - 4HR + .05W + 1.5SB)*.76
C = AB - H
D = HR
Naturally, A*B/(B + C) + D.

I have explained the methodology used to figure the PFs before, but the cliff’s notes version is that they are based on five years of data when applicable, include both runs scored and allowed, and they are regressed towards average (PF = 1), with the amount of regression varying based on the number of years of data used. There are factors for both runs and home runs. The initial PF (not shown) is:

iPF = (H*T/(R*(T - 1) + H) + 1)/2
where H = RPG in home games, R = RPG in road games, T = # teams in league (14 for AL and 16 for NL). Then the iPF is converted to the PF by taking x*iPF + (1-x), where x = .6 if one year of data is used, .7 for 2, .8 for 3, and .9 for 4+.

It is important to note, since there always seems to be confusion about this, that these park factors already incorporate the fact that the average player plays 50% on the road and 50% at home. That is what the adding one and dividing by 2 in the iPF is all about. So if I list Fenway Park with a 1.02 PF, that means that it actually increases RPG by 4%.

In the calculation of the PFs, I did not get picky and take out “home” games that were actually at neutral sites, like the Astros/Cubs series that was moved to Milwaukee in 2008.

There are also Team Offense and Defense spreadsheets. These include the following categories:

Team offense: Plate Appearances, Batting Average (BA), On Base Average (OBA), Slugging Average (SLG), Secondary Average (SEC), Walks per At Bat (WAB), Isolated Power (SLG - BA), R/G at home (hR/G), and R/G on the road (rR/G) BA, OBA, SLG, WAB, and ISO are park-adjusted by dividing by the square root of park factor (or the equivalent; WAB = (OBA - BA)/(1 - OBA) and ISO = SLG - BA).

Team defense: Innings Pitched, BA, OBA, SLG, Innings per Start (IP/S), Starter's eRA (seRA), Reliever's eRA (reRA), RA/G at home (hRA/G), RA/G on the road (rRA/G), Battery Mishap Rate (BMR), Modified Fielding Average (mFA), and Defensive Efficiency Record (DER). BA, OBA, and SLG are park-adjusted by dividing by the square root of PF; seRA and reRA are divided by PF.

The three fielding metrics I've included are limited it only to metrics that a) I can calculate myself and b) are based on the basic available data, not specialized PBP data. The three metrics are explained in this post, but here are quick descriptions of each:

1) BMR--wild pitches and passed balls per 100 baserunners = (WP + PB)/(H + W - HR)*100

2) mFA--fielding average removing strikeouts and assists = (PO - K)/(PO - K + E)

3) DER--the Bill James classic, using only the PA-based estimate of plays made. Based on a suggestion by Terpsfan101, I've tweaked the error coefficient. Plays Made = PA - K - H - W - HR - HB - .64E and DER = PM/(PM + H - HR + .64E)

Next are the individual player reports. I defined a starting pitcher as one with 15 or more starts. All other pitchers are eligible to be included as a reliever. If a pitcher has 40 appearances, then they are included. Additionally, if a pitcher has 50 innings and less than 50% of his appearances are starts, he is also included as a reliever (this allows some swingmen type pitchers who wouldn’t meet either the minimum start or appearance standards to get in).

For all of the player reports, ages are based on simply subtracting their year of birth from 2011. I realize that this is not compatible with how ages are usually listed and so “Age 27” doesn’t necessarily correspond to age 27 as I list it, but it makes everything a heckuva lot easier, and I am more interested in comparing the ages of the players to their contemporaries, for which case it makes very little difference. The "R" category records rookie status with a "R" for rookies and a blank for everyone else; I've trusted Baseball Prospectus on this. Also, all players are counted as being on the team with whom they played/pitched (IP or PA as appropriate) the most.

For relievers, the categories listed are: Games, Innings Pitched, Run Average (RA), Relief Run Average (RRA), Earned Run Average (ERA), Estimated Run Average (eRA), DIPS Run Average (dRA), Batted Ball Run Average (cRA), SIERA-style Run Average (sRA), Guess-Future (G-F), Inherited Runners per Game (IR/G), Batting Average on Balls in Play (%H), Runs Above Average (RAA), and Runs Above Replacement (RAR).

IR/G is per relief appearance (G - GS); it is an interesting thing to look at, I think, in lieu of actual leverage data. You can see which closers come in with runners on base, and which are used nearly exclusively to start innings. Of course, you can’t infer too much; there are bad relievers who come in with a lot of people on base, not because they are being used in high leverage situations, but because they are long men being used in low-leverage situations already out of hand.

For starting pitchers, the columns are: Wins, Losses, Innings Pitched, RA, RRA, ERA, eRA, dRA, cRA, sRA, G-F, %H, Pitches/Start (P/S), Quality Start Percentage (QS%), RAA, and RAR. RA and ERA you know--R*9/IP or ER*9/IP, park-adjusted by dividing by PF. The formulas for eRA, dRA, cRA, and sRA are in this article; I'm not going to copy them here, but all of them are based on the same Base Runs equation and they all estimate RA, not ERA:

* eRA is based on the actual results allowed by the pitcher (hits, doubles, home runs, walks, strikeouts, etc.). It is park-adjusted by dividing by PF.

* dRA is the classic DIPS-style RA, assuming that the pitcher allows a league average %H, and that his hits in play have a league-average S/D/T split. It is park-adjusted by dividing by PF.

* cRA is based on batted ball type (FB, GB, POP, LD) allowed, using the actual estimated linear weight value for each batted ball type. It is not park-adjusted.

* sRA is a SIERA-style RA, based on batted balls but broken down into just groundballs and non-groundballs. It is not park-adjusted either.

Both cRA and sRA are running a little high when compared to actual RA for 2010. Both measures are very sensitive and need to be recalibrated in order to overcome batted ball-type definition differences, frequencies of hit types on each kind of batted ball, and other factors, so keep in mind that they may not perfectly track RA without those adjustments (which I have not made in this case). I’ll let you make your own determination as to whether you find this data useful at all. Personally, I prefer to look at RRA, eRA, and dRA.

G-F is a junk stat, included here out of habit because I've been including it for years. It was intended to give a quick read of a pitcher's expected performance in the next season, based on eRA and strikeout rate. Although the numbers vaguely resemble RAs, it's actually unitless. As a rule of thumb, anything under four is pretty good for a starter. G-F = 4.46 + .095(eRA) - .113(K*9/IP). It is a junk stat. JUNK STAT JUNK STAT JUNK STAT. Got it?

%H is BABIP, more or less; I use an estimate of PA (IP*x + H + W, where x is the league average of (AB - H)/IP). %H = (H - HR)/(IP*x + H - HR - K). Pitches/Start includes all appearances, so I've counted relief appearances as one-half of a start (P/S = Pitches/(.5*G + .5*GS). QS% is just QS/(G - GS); I don't think it's particularly useful, but Doug's Stats include QS so I include it.

I've used a stat called Relief Run Average (RRA) in the past, based on Sky Andrecheck's article in the August 1999 By the Numbers; that one only used inherited runners, but I've revised it to include bequeathed runners as well, making it equally applicable to starters and relievers. I am using RRA as the building block for baselined value estimates for all pitchers this year. I explained RRA in this article, but the bottom line formulas are:

BRSV = BRS - BR*i*sqrt(PF)
IRSV = IR*i*sqrt(PF) - IRS
RRA = ((R - (BRSV + IRSV))*9/IP)/PF

The two baselined stats are Runs Above Average (RAA) and Runs Above Replacement (RAR). RAA uses the league average runs/game (N) for both starters and relievers, while RAR uses separate replacement levels for starters and relievers. Thus, RAA and RAR will be pretty close for relievers:

RAA = (N - RRA)*IP/9
RAR (relievers) = (1.11*N - RRA)*IP/9
RAR (starters) = (1.28*N - RRA)*IP/9

All players with 285 or more plate appearances are included in the Hitters spreadsheets. (I usually use 300 as a cutoff, but this year when I had the list sorted there were a number of players just below 300 that I was interested in, so I chose an arbitrarily lower threshold). Each is assigned one position, the one at which they appeared in the most games. The statistics presented are: Games played (G), Plate Appearances (PA), Outs (O), Batting Average (BA), On Base Average (OBA), Slugging Average (SLG), Secondary Average (SEC), Runs Created (RC), Runs Created per Game (RG), Speed Score (SS), Hitting Runs Above Average (HRAA), Runs Above Average (RAA), Hitting Runs Above Replacement (HRAR), and Runs Above Replacement (RAR).

I do not bother to include hit batters, so take note of that for players who do get plunked a lot. Therefore, PA are simply AB + W. Outs are AB - H + CS. BA and SLG you know, but remember that without HB and SF, OBA is just (H + W)/(AB + W). Secondary Average = (TB - H + W)/AB = SLG - BA + (OBA - BA)/(1 - OBA). I have not included net steals as many people (and Bill James himself) do--it is solely hitting events.

BA, OBA, and SLG are park-adjusted by dividing by the square root of PF. This is an approximation, of course, but I'm satisfied that it works well. The goal here is to adjust for the win value of offensive events, not to quantify the exact park effect on the given rate. I use the BA/OBA/SLG-based formula to figure SEC, so it is park-adjusted as well.

Runs Created is actually Paul Johnson's ERP, more or less. Ideally, I would use a custom linear weights formula for the given league, but ERP is just so darn simple and close to the mark that it’s hard to pass up. I still use the term “RC” partially as a homage to Bill James (seriously, I really like and respect him even if I’ve said negative things about RC and Win Shares), and also because it is just a good term. I like the thought put in your head when you hear “creating” a run better than “producing”, “manufacturing”, “generating”, etc. to say nothing of names like “equivalent” or “extrapolated” runs. None of that is said to put down the creators of those methods--there just aren’t a lot of good, unique names available. Anyway, RC = (TB + .8H + W + .7SB - CS - .3AB)*.322.

RC is park adjusted by dividing by PF, making all of the value stats that follow park adjusted as well. RG, the rate, is RC/O*25.5. I do not believe that outs are the proper denominator for an individual rate stat, but I also do not believe that the distortions caused are that bad. (I still intend to finish my rate stat series and discuss all of the options in excruciating detail, but alas you’ll have to take my word for it now).

I have decided to switch to a watered-down version of Bill James' Speed Score this year; I only use four of his categories. Previously I used my own knockoff version called Speed Unit, but trying to keep it from breaking down every few years was a wasted effort.

Speed Score is the average of four components, which I'll call a, b, c, and d:

a = ((SB + 3)/(SB + CS + 7) - .4)*20
b = sqrt((SB + CS)/(S + W))*14.3
c = ((R - HR)/(H + W - HR) - .1)*25
d = T/(AB - HR - K)*450

James actually uses a sliding scale for the triples component, but it strikes me as needlessly complex and so I've streamlined it. I also changed some of his division to mathematically equivalent multiplications.

There are a whopping four categories that compare to a baseline; two for average, two for replacement. Hitting RAA compares to a league average hitter; it is in the vein of Pete Palmer’s Batting Runs. RAA compares to an average hitter at the player’s primary position. Hitting RAR compares to a “replacement level” hitter; RAR compares to a replacement level hitter at the player’s primary position. The formulas are:

HRAA = (RG - N)*O/25.5
RAA = (RG - N*PADJ)*O/25.5
HRAR = (RG - .73*N)*O/25.5
RAR = (RG - .73*N*PADJ)*O/25.5

PADJ is the position adjustment, and it is based on 1992-2001 offensive data. For catchers it is .89; for 1B/DH, 1.19; for 2B, .93; for 3B, 1.01; for SS, .86; for LF/RF, 1.12; and for CF, 1.02. It dawned on me when re-reading this before posting that the timeframe means that I’ve been using the same PADJ for ten years--which means two things:

1) I’m getting old
2) It’s probably time for an update. I’ll look at 2002-2011 in my forthcoming annual “Offense by Postion” post

That was the mechanics of the calculations; now I'll twist myself into knots trying to justify them. If you only care about the how and not the why, stop reading now.

The first thing that should be covered is the philosophical position behind the statistics posted here. They fall on the continuum of ability and value in what I have called "performance". Performance is a technical-sounding way of saying "Whatever arbitrary combination of ability and value I prefer".

With respect to park adjustments, I am not interested in how any particular player is affected, so there is no separate adjustment for lefties and righties for instance. The park factor is an attempt to determine how the park affects run scoring rates, and thus the win value of runs.

I apply the park factor directly to the player's statistics, but it could also be applied to the league context. The advantage to doing it my way is that it allows you to compare the component statistics (like Runs Created or OBA) on a park-adjusted basis. The drawback is that it creates a new theoretical universe, one in which all parks are equal, rather than leaving the player grounded in the actual context in which he played and evaluating how that context (and not the player's statistics) was altered by the park.

The good news is that the two approaches are essentially equivalent; in fact, they are equivalent if you assume that the Runs Per Win factor is equal to the RPG. Suppose that we have a player in an extreme park (PF = 1.15, approximately like Coors Field pre-humidor) who has an 8 RG before adjusting for park, while making 350 outs in a 4.5 N league. The first method of park adjustment, the one I use, converts his value into a neutral park, so his RG is now 8/1.15 = 6.957. We can now compare him directly to the league average:

RAA = (6.957 - 4.5)*350/25.5 = +33.72

The second method would be to adjust the league context. If N = 4.5, then the average player in this park will create 4.5*1.15 = 5.175 runs. Now, to figure RAA, we can use the unadjusted RG of 8:

RAA = (8 - 5.175)*350/25.5 = +38.77

These are not the same, as you can obviously see. The reason for this is that they take place in two different contexts. The first figure is in a 9 RPG (2*4.5) context; the second figure is in a 10.35 RPG (2*4.5*1.15) context. Runs have different values in different contexts; that is why we have RPW converters in the first place. If we convert to WAA (using RPW = RPG), then we have:

WAA = 33.72/9 = +3.75
WAA = 38.77/10.35 = +3.75

Once you convert to wins, the two approaches are equivalent. The other nice thing about the first approach is that once you park-adjust, everyone in the league is in the same context, and you can dispense with the need for converting to wins at all. You still might want to convert to wins, and you'll need to do so if you are comparing the 2010 players to players from other league-seasons (including between the AL and NL in the same year), but if you are only looking to compare Jose Bautista to Miguel Cabrera, it's not necessary. WAR is somewhat ubiquitous now, but personally I prefer runs when possible--why mess with decimal points if you don't have to?

The park factors used to adjust player stats here are run-based. Thus, they make no effort to project what a player "would have done" in a neutral park, or account for the difference effects parks have on specific events (walks, home runs, BA) or types of players. They simply account for the difference in run environment that is caused by the park (as best I can measure it). As such, they don't evaluate a player within the actual run context of his team's games; they attempt to restate the player's performance as an equivalent performance in a neutral park.

I suppose I should also justify the use of sqrt(PF) for adjusting component statistics. The classic defense given for this approach relies on basic Runs Created--runs are proportional to OBA*SLG, and OBA*SLG/PF = OBA/sqrt(PF)*SLG/sqrt(PF). While RC may be an antiquated tool, you will find that the square root adjustment is fairly compatible with linear weights or Base Runs as well. I am not going to take the space to demonstrate this claim here, but I will some time in the future.

Many value figures published around the sabersphere adjust for the difference in quality level between the AL and NL. I don't, but this is a thorny area where there is no right or wrong answer as far as I'm concerned. I also do not make an adjustment in the league averages for the fact that the overall NL averages include pitcher batting and the AL does not (not quite true in the era of interleague play, but you get my drift).

The difference between the leagues may not be precisely calculable, and it certainly is not constant, but it is real. If the average player in the AL is better than the average player in the NL, it is perfectly reasonable to expect the average AL player to have more RAR than the average NL player, and that will not happen without some type of adjustment. On the other hand, if you are only interested in evaluating a player relative to his own league, such an adjustment is not necessarily welcome.

The league argument only applies cleanly to metrics baselined to average. Since replacement level compares the given player to a theoretical player that can be acquired on the cheap, the same pool of potential replacement players should by definition be available to the teams of each league. One could argue that if the two leagues don't have equal talent at the major league level, they might not have equal access to replacement level talent--except such an argument is at odds with the notion that replacement level represents talent that is truly "freely available".

So it's hard to justify the approach I take, which is to set replacement level relative to the average runs scored in each league, with no adjustment for the difference in the leagues. The best justification is that it's simple and it treats each league as its own universe, even if in reality they are connected.

The replacement levels I have used here are very much in line with the values used by other sabermetricians. This is based both on my own "research", my interpretation of other's people research, and a desire to not stray from consensus and make the values unhelpful to the majority of people who may encounter them.

Replacement level is certainly not settled science. There is always going to be room to disagree on what the baseline should be. Even if you agree it should be "replacement level", any estimate of where it should be set is just that--an estimate. Average is clean and fairly straightforward, even if its utility is questionable; replacement level is inherently messy. So I offer the average baseline as well.

For position players, replacement level is set at 73% of the positional average RG (since there's a history of discussing replacement level in terms of winning percentages, this is roughly equivalent to .350). For starting pitchers, it is set at 128% of the league average RA (.380), and for relievers it is set at 111% (.450).

I am still using an analytical structure that makes the comparison to replacement level for a position player by applying it to his hitting statistics. This is the approach taken by Keith Woolner in VORP (and some other earlier replacement level implementations), but the newer metrics (among them Rally and Fangraphs' WAR) handle replacement level by subtracting a set number of runs from the player's total runs above average in a number of different areas (batting, fielding, baserunning, positional value, etc.), which for lack of a better term I will call the subtraction approach.

The offensive positional adjustment makes the inherent assumption that the average player at each position is equally valuable. I think that this is close to being true, but it is not quite true. The ideal approach would be to use a defensive positional adjustment, since the real difference between a first baseman and a shortstop is their defensive value. When you bat, all runs count the same, whether you create them as a first baseman or as a shortstop.

That being said, using “replacement hitter at position” does not cause too many distortions. It is not theoretically correct, but it is practically powerful. For one thing, most players, even those at key defensive positions, are chosen first and foremost for their offense. Empirical work by Keith Woolner has shown that the replacement level hitting performance is about the same for every position, relative to the positional average.

Figuring what the defensive positional adjustment should be, though, is easier said than done. Therefore, I use the offensive positional adjustment. So if you want to criticize that choice, or criticize the numbers that result, be my guest. But do not claim that I am holding this up as the correct analytical structure. I am holding it up as the most simple and straightforward structure that conforms to reality reasonably well, and because while the numbers may be flawed, they are at least based on an objective formula that I can figure myself. If you feel comfortable with some other assumptions, please feel free to ignore mine.

That still does not justify the use of HRAR--hitting runs above replacement--which compares each hitter, regardless of position, to 73% of the league average. Basically, this is just a way to give an overall measure of offensive production without regard for position with a low baseline. It doesn't have any real baseball meaning.

A player who creates runs at 90% of the league average could be above-average (if he's a shortstop or catcher, or a great fielder at a less important fielding position), or sub-replacement level (DHs that create 4 runs a game are not valuable properties). Every player is chosen because his total value, both hitting and fielding, is sufficient to justify his inclusion on the team. HRAR fails even if you try to justify it with a thought experiment about a world in which defense doesn't matter, because in that case the absolute replacement level (in terms of RG, without accounting for the league average) would be much higher than it is currently.

The specific positional adjustments I use are based on 1992-2001 data. There's no particular reason for not updating them; at the time I started using them, they represented the ten most recent years. I have stuck with them because I have not seen compelling evidence of a change in the degree of difficulty or scarcity between the positions between now and then, and because I think they are fairly reasonable. The positions for which they diverge the most from the defensive position adjustments in common use are 2B, 3B, and CF. Second base is considered a premium position by the offensive PADJ (.94), while third base and center field are both neutral (1.01 and 1.02).

Another flaw is that the PADJ is applied to the overall league average RG, which is artificially low for the NL because of pitcher's batting. When using the actual league average runs/game, it's tough to just remove pitchers--any adjustment would be an estimate. If you use the league total of runs created instead, it is a much easier fix.

One other note on this topic is that since the offensive PADJ is a proxy for average defensive value by position, ideally it would be applied by tying it to defensive playing time. I have done it by outs, though.

The reason I have taken this flawed path is because 1) it ties the position adjustment directly into the RAR formula rather then leaving it as something to subtract on the outside and more importantly 2) there’s no straightforward way to do it. The best would be to use defensive innings--set the full-time player to X defensive innings, figure how Derek Jeter’s innings compared to X, and adjust his PADJ accordingly. Games in the field or games played are dicey because they can cause distortion for defensive replacements. Plate Appearances avoid the problem that outs have of being highly related to player quality, but they still carry the illogic of basing it on offensive playing time. And of course the differences here are going to be fairly small (a few runs). That is not to say that this way is preferable, but it’s not horrible either, at least as far as I can tell.

To compare this approach to the subtraction approach, start by assuming that a replacement level shortstop would create .86*.73*4.5 = 2.825 RG (or would perform at an overall level of equivalent value to being an average fielder at shortstop while creating 2.825 runs per game). Suppose that we are comparing two shortstops, each of whom compiled 600 PA and played an equal number of defensive games and innings (and thus would have the same positional adjustment using the subtraction approach). Alpha made 380 outs and Bravo made 410 outs, and each ranked as dead-on average in the field.

The difference in overall RAR between the two using the subtraction approach would be equal to the difference between their offensive RAA compared to the league average. Assuming the league average is 4.5 runs, and that both Alpha and Bravo created 75 runs, their offensive RAAs are:

Alpha = (75*25.5/380 - 4.5)*380/25.5 = +7.94

Similarly, Bravo is at +2.65, and so the difference between them will be 5.29 RAR.

Using the flawed approach, Alpha's RAR will be:

(75*25.5/380 - 4.5*.73*.86)*380/25.5 = +32.90

Bravo's RAR will be +29.58, a difference of 3.32 RAR, which is two runs off of the difference using the subtraction approach.

The downside to using PA is that you really need to consider park effects if you, whereas outs allow you to sidestep park effects. Outs are constant; plate appearances are linked to OBA. Thus, they not only depend on the offensive context (including park factor), but also on the quality of one's team. Of course, attempting to adjust for team PA differences opens a huge can of worms which is not really relevant; for now, the point is that using outs for individual players causes distortions, sometimes trivial and sometimes bothersome, but almost always makes one's life easier.

I do not include fielding (or baserunning outside of steals, although that is a trivial consideration in comparison) in the RAR figures--they cover offense and positional value only). This in no way means that I do not believe that fielding is an important consideration in player valuation. However, two of the key principles of these stat reports are 1) not incorporating any data that is not readily available and 2) not simply including other people's results (of course I borrow heavily from other people's methods, but only adapting methodology that I can apply myself).

Any fielding metric worth its salt will fail to meet either criterion--they use zone data or play-by-play data which I do not have easy access to. I do not have a fielding metric that I have stapled together myself, and so I would have to simply lift other analysts' figures.

Setting the practical reason for not including fielding aside, I do have some reservations about lumping fielding and hitting value together in one number because of the obvious differences in reliability between offensive and fielding metrics. In theory, they absolutely should be put together. But in practice, I believe it would be better to regress the fielding metric to a point at which it would be roughly equivalent in reliability to the offensive metric.

Offensive metrics have error bars associated with them, too, of course, and in evaluating a single season's value, I don't care about the vagaries that we often lump together as "luck". Still, there are errors in our assessment of linear weight values and players that collect an unusual proportion of infield hits or hits to the left side, errors in estimation of park factor, and any number of other factors that make their events more or less valuable than an average event of that type.

Fielding metrics offer up all of that and more, as we cannot be nearly as certain of true successes and failures as we are when analyzing offense. Recent investigations, particularly by Colin Wyers, have raised even more questions about the level of uncertainty. So, even if I was including a fielding value, my approach would be to assume that the offensive value was 100% reliable (which it isn't), and regress the fielding metric relative to that (so if the offensive metric was actually 70% reliable, and the fielding metric 40% reliable, I'd treat the fielding metric as .4/.7 = 57% reliable when tacking it on, to illustrate with a simplified and completely made up example presuming that one could have a precise estimate of nebulous "reliability").

Given the inherent assumption of the offensive PADJ that all positions are equally valuable, once RAR has been figured for a player, fielding value can be accounted for by adding on his runs above average relative to a player at his own position. If there is a shortstop that is -2 runs defensively versus an average shortstop, he is without a doubt a plus defensive player, and a more valuable defensive player than a first baseman who was +1 run better than an average first baseman. Regardless, since it was implicitly assumed that they are both average defensively for their position when RAR was calculated, the shortstop will see his value docked two runs. This DOES NOT MEAN that the shortstop has been penalized for his defense. The whole process of accounting for positional differences, going from hitting RAR to positional RAR, has benefited him.

I've found that there is often confusion about the treatment of first baseman and designated hitters in my PADJ methodology, since I consider DHs as in the same pool as first baseman. The fact of the matter is that first baseman outhit DH. There is any number of potential explanations for this; DHs are often old or injured, players hit worse when DHing than they do when playing the field, etc. This actually helps first baseman, since the DHs drag the average production of the pool down, thus resulting in a lower replacement level than I would get if I considered first baseman alone.

However, this method does assume that a 1B and a DH have equal defensive value. Obviously, a DH has no defensive value. What I advocate to correct this is to treat a DH as a bad defensive first baseman, and thus knock another five or ten runs off of his RAR for a full-time player. I do not incorporate this into the published numbers, but you should keep it in mind. However, there is no need to adjust the figures for first baseman upwards --the only necessary adjustment is to take the DHs down a notch.

Finally, I consider each player at his primary defensive position (defined as where he appears in the most games), and do not weight the PADJ by playing time. This does shortchange a player like Ben Zobrist (who saw significant time at a tougher position than his primary position), and unduly boost a player like Buster Posey (who logged a lot of games at a much easier position than his primary position). For most players, though, it doesn't matter much. I find it preferable to make manual adjustments for the unusual cases rather than add another layer of complexity to the whole endeavor.

Player spreadsheets should be coming by the middle of the week.

2011 Park Factors

2011 Leagues

2011 Teams

2011 Team Offense

2011 Team Defense

2011 AL Relievers

2011 NL Relievers

2011 AL Starters

2011 NL Starters

2011 AL Hitters

2011 NL Hitters