Showing posts with label Playoffs. Show all posts

Monday, October 04, 2021

Crude Playoff Odds--2021

These are very simple playoff odds, based on my crude rating system for teams using an equal mix of W%, EW% (based on R/RA), PW% (based on RC/RCA), and 69 games of .500. They account for home field advantage by assuming a .500 team wins 54.2% of home games (major league average 2006-2015). They assume that a team's inherent strength is constant from game-to-game. They do not generally account for any number of factors that you would actually want to account for if you were serious about this, including but not limited to injuries, the current construction of the team rather than the aggregate seasonal performance, pitching rotations, estimated true talent of the players, etc.

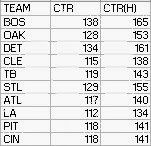
The CTRs that are fed in are:


Wildcard game odds (the least useful since the pitching matchups aren’t taken into account, and that matters most when there is just one game):


DS:


LCS:


World Series:


Everything combined:


If the Dodgers win the wildcard game, they become the World Series favorites at 19.9%, with the Giants falling to 19.0%; the Rays fall to 16.1%, so the Dodgers don't have a huge impact on the AL odds (the Dodgers are given a 32.6% to win the pennant should they win the wildcard game). If the Cardinals win, the Giants jump to 25.9% and the Rays to 17.6% (of course the Giants benefit greatly because they have an estimated 68% chance to beat the Cardinals in the NLDS but only 50% to beat the Dodgers). Ranging into the realm of the subjective, I personally favor Houston to win the AL pennant and think Milwaukee will benefit from concentrating innings in front-line pitchers (even sans Devin Williams) and from being on the opposite side of the bracket from the NL West.

I don't have the energy for a rant about what a preposterous proposition it is to make the Dodgers play the Cardinals, or about how the much-hyped four-way battle for the AL wildcard yesterday would never happen under Rob Manfred's desired system (or how if it did it would be between teams struggling to reach .500). The playoffs simultaneously manage to be one of the best and worst things about baseball, and every expansion will serve to enhance the latter.

Sunday, October 18, 2020

In Defense of the Astros

I am glad to be writing this post as an irrelevant digression rather than a timely attempt to wrap one’s mind around the possibility of a team with a 29-31 regular season record winning the World Series. My standard outlook when watching the playoffs is to pull for the better team. This is not an ironclad rule, as I do allow my various prejudices (fandom, a favorite player, a least favorite player, style of play, etc.) to override the general principle. I also do this despite being unable to be truly surprised by any outcome of a seven-game series between any two legitimate major league baseball teams. That it does not at all surprise me when inferior teams win series against superior teams, and while it can occasionally be fun to see this happen just to see the egg on the face of people who wildly overestimate the probability of the better team winning (for me, the 2010-11 Phillies were the archetype of this phenomenon), I generally find it disappointing.

After Houston tied the series at three, though, and as I read some online reactions to the possibility of them appearing in the World Series, I decided it would be worthwhile to explain at length why I do not feel that they would be an illegitimate champion should it come to pass. The fact that it did not come to pass makes this discussion academic, but look at where you are. One thing that should be said upfront is that given the emotion generated by the Astros, it is impossible to disentangle how much of the backlash to the possibility of them winning was rooted in genuine concern about the legitimacy of the outcome of the MLB season (concerns that, I have argued, would have been much better channeled towards the possibility of Miami advancing deep into the playoffs), and how much is simply rationalization for the often disproportionate reaction to the sign stealing scandal. There are also people who are looking for any reason to discount the 2020 season, whether out of allowing the perfect to be the enemy of the good (I just cannot relate to people who would rather see no season than 60 games; neither can the bank accounts of the players), or out of darker authoritarian and totalitarian impulses. Arguments borne from there are outside the scope of this piece – this is about the implications of a 29-31 team appearing in or winning the World Series.

The first question that should be asked is “How good are the Astros, really?” My answer is – almost certainly better than 29-31. Why do I say that?

1. The Astros underlying performance was better than their win-loss record

The Astros scored 4.80 and allowed 4.72 runs per nine innings, which in a world of nine-inning games would be expected to result in a winning percentage of .508. The Astros tallied 4.58 runs created and 4.50 runs created allowed per nine innings, which in that same world would also be expected to be allowed in a winning percentage of .508.

Of course, this is not significantly or in any way meaningfully different than their actual W% of .483, but if you have a psychological hangup on a sub-.500 team winning a pennant, their underlying performance was ever so slightly better than that of a .500 team, and to the extent that these tiny differences mean anything, they should mean more the smaller the sample size of games actually is.

2. The Astros win-loss record would likely have been over .500, even at their same level of performance, had a normal schedule been played

Last year, the AL West was the best division in MLB, with an average schedule-adjusted W% of .527 (of course, the Astros as the best team in baseball contributed much to this). The NL West was third at .510. While such calculations cannot be made for 2020 because of the lack of inter-geographic games (we can add the playoffs in, but they don’t provide a sufficient sample to be relied upon, although it is hard not to notice the complete playoff decimation of the Central), my guess is that playing a western-only schedule was tougher than the average schedule faced by a MLB team. This also suggests a slightly better than .500 true performance.

3. Most importantly, the Astros’ true talent was significantly better than that of a .483 team

Some time before the season, I grabbed the win projections from three sources that I think do quality work on these sorts of questions: Baseball Prospectus, Clay Davenport, and Fangraphs. Their win projections for the Astros were 36, 36, and 35. Respectively, that put them second, first, and tied for first in the AL (I should note, I didn’t record the date I jotted down these numbers, so they may not have represented the final estimate from each source).

Of course, things changed, most notably the injuries to Justin Verlander and Yordan Alvarez, but these are insufficient to take a 35 win team to under .500. Some Houston hitters (particularly Jose Altuve) had poor seasons that might have recalibrated estimates of their true talent, but how much stock can you put in sixty games of additional data, and there are players going the other direction too (Framber Valdez is a big one). It seems highly likely that the Astros underlying true talent was that of a winning team.

I note this not to self-aggrandize (heavens knows I’m wrong about these things more than I’m right), but rather to cover myself in case anyone looks back at my 2020 Predictions post, I actually did not pick the Astros to make the playoffs under the traditional format, but did once the field was expanded. While I did not expound on my logic, I did think the Astros were more vulnerable than the purely objective approaches did, mainly because I thought that a starting staff anchored by two pitchers older than me was not a foolproof plan (even if they are Hall of Famers to be). I actually picked the Rays to win the AL pennant, which didn’t take any particular insight but viewed in the wrong light could discredit the opinions I’m expressing here.

If you now will accept the premise that the Astros 1) performed like a winning team 2) would have been a winning team against a normal schedule and 3) could expect to perform better over any stretch of future games due to their underlying talent, are the Astros in fact a beneficiary of a sixty-game season – or a victim? I would argue the latter – the 2020 Astros were a good team that happened to have a mediocre record, largely caused by a season with a schedule that was too short and too unbalanced.

I don’t know what the purpose of a playoff system is (actually I do – it’s to make money). Is it an attempt to reward the teams that performed the best in the regular season? (I’m pretty sure it’s not). Is it an attempt to identify the best team, treating the regular season only as a means of culling the herd? (I think many fans feel this way, which I think is crazy). In reality it is likely some combination of all three. But if the point of a playoff system is to use the regular season to cull the herd, then attempt to identify the best team, I am far from convinced that the Astros should not have been a beneficiary of such a system. And while I would generally consider such a system foolhardy, it is certainly more defensible when the regular season used to do the culling is only sixty games – we should have much less confidence that the results of the sixty games should count for more than the results of the playoffs than we normally would be.

To put this into quantifiable terms, let’s suppose that we decide that in order for a champion to be legitimate, they have to meet some minimal standard of competence. We could then test the worthiness of a champion by calculating the probability that a team that met that minimum standard of competence would have compiled a record equal or worse than the team in question.

For example, let’s say that we decree that in order to be a worthy champion, a team should be at least a true .556 W% team. This is of course an arbitrary value; I’ve chosen it because it corresponds to a 90 win team, which is a value I have always subjectively thought of as marking a legitimate contender. So under this argument, we will accept the playoff result as legitimate, to the extent that the champion it produces was in fact a 90 win quality team.

Using the binomial distribution, it is simple to calculate the probability that a team with a given W% would have a record of 29-31 or worse. The probability of a .556 team going 29-31 or worse over sixty games is 15.8%. Contrast this with the Rays, who were 40-20, which would happen with probability 97.0%.

What would an equivalent performance to Houston’s 29-31 be over the course of 162 games? A .556 team would win 83 or fewer with a probability of 14.9% and 84 or fewer with a probability of 18.9%. The 2006 Cardinals won the World Series after going 83-78 (darn that missing game; the probability for 83-78 is 17.0%). So if you demand that your world champion be at least a .556 team, you could plausibly argue that the Astros would have been the least worthy champion in history. (I would in fact argue that the Astros were more worthy under this criteria based on the considerations discussed above, particularly strength of schedule since it remains grounded in actual wins and losses rather than component performance or true talent).

But .556 may well be setting the bar too low. Is it too much to demand that a world champion be a .600 team (equivalent to about 97 wins)? One could certainly argue that it is not – the champion should be a team that has demonstrated excellence, not simply a contender.

The probability that a .600 team would win 29 or fewer out of 60 is 4.4%. Conveniently, the probability that a .600 team would win 86 or fewer out of 162 is 4.4%. So under this formulation, the Astros could be seen as an equally worthy champion to a team that went 86-76 over a full season. The 2006 Cardinals are joined by the 1987 Twins (85-77) in not clearing this bar, and the 2014 Giants (88-74) were close as well. Of course, in all cases I would argue that we should at least adjust actual wins for strength of schedule, but I think this suffices to make the point. One can make a very logical case that a 29-31 team would not in fact have been the least worthy World Series winner in history. (I am only going to hint at the low hanging fruit offered by the sixty-game record of the reigning world champions who denied a much more worthy team called the Astros in 2019).

Saturday, October 10, 2020

Meanderings

* I used to get emails when there were comments awaiting moderation. This stopped at some point, and so there were a handful of non-spam comments that had been lingering for some time. I want to thank Tango Tiger and David Pinto (along with a couple anonymous readers) for their comments and apologize for neglecting to publish them until now.

* I’ve watched the overwhelming majority of playoff games played since 1997, and I think Game 5 of the TB/NYA ALDS was possibley one of the ten best games I remember. I say I think because a) recency bias is real and 2) I haven’t sat down and comprehensively reviewed past games to make sure I didn’t miss any. Some that stood out off the top of my head are:

1997 ALDS Game 4 (CLE/NYA)

1997 ALCS Game 6 (CLE/BAL)

1999 NLCS Game 5 (NYN/ATL)

2001 WS Game 7 (ARI/NYA)

2003 ALCS Game 7 (NYA/BOS)

2004 ALCS Game 4 (BOS/NYA)

2005 NLDS Game 4 (HOU/ATL)

2005 NLCS Game 5 (STL/HOU)

2006 NLCS Game 7 (STL/NYN)

2011 WS Game 6 (STL/TEX)

2012 NLDS Game 4 (WAS/STL)

2017 WS Game 5 (HOU/LA)

I think the Rays/Yankees tilt belongs in the company of those games. So imagine my surprise when I perused some comments online and saw people using the game as an occasion to recite their evergreen complaints about modern baseball, particularly in this case focused on the fact that the game wasn’t decided by the starting pitchers, and that all of the runs scored on home runs.

In looking at the above list of eleven games that were particularly memorable, you know what I can tell you about only a handful of them – the identities of the starting pitchers (Nagy/Mussina, Schilling/Johnson, Pedro...that’s about all I got). If you are complaining that pitchers rarely complete games in October, well, you missed the boat twenty-five years ago. While one may aesthetically prefer games determined by starters, I think the Rays/Yankees game is an odd one to find flaw with on that front. The fact of the matter is that the playoff format preordained that a decisive game would not be decided by the starters. Gerrit Cole started on short rest and made about as many pitches as could have reasonably been expected. And the lack of an obvious choice of starter actually contributed to one of the great features of this game, namely Kevin Cash’s perfectly executed plan to essentially use one of his best pitchers for each time through the order.

As to the aesthetics of the home run/strikeout game, I think there is a lot of projection going on. People know that they don’t fancy high-HR, high-K baseball, which is certainly their prerogative, but they pretend to know universally what all potential consumers of baseball find aesthetically pleasing. I have not seen any convincing evidence that the current style of baseball is driving people away from the game – arguments that focus on TV ratings are guilty of presupposing that a multi-faceted phenomenon can be boiled down to the stated aesthetic preferences of those who advance them.

You know what wouldn’t have made that game any more memorable? If five strikeouts had been replaced by five ground balls rolled over to second.

When I flip over to the NBA Finals for a few minutes and see Anthony Davis shooting threes, I think that I would much rather see Hakeem Olajuwon and Patrick Ewing battling each other in the post. Whenever I watch a NFL game, I think about how much more pleasing it would be to watch if teams occasionally lined up in the I or the Pro Set on 2nd & 7, and the quarterback was under center unless it was third & long. But I don’t suppose that my own preferences in these regards are indicative of those of the audience at large, or somehow representative of the manner in which basketball or football “should” be played.

Do the aesthetic flaws I find with those games reduce my interest in them from previous levels? Sure, although the primary reason I watch less NBA or NFL than I did previously is that as other obligations and interests reduce the total time I have available to devote to sports, I choose to achieve that by holding the time I allot to baseball reasonably constant, thereby crowding out the lesser sports. Even if the games returned to styles that I preferred, my time investment would not significantly increase – and I think the same is true for many of the complainers about baseball. In fact, I think many of them use the aesthetic argument as an excuse. For whatever reason, many of them have less time to devote to baseball, or feel that it is in someway childish or otherwise a waste of time. Aesthetics makes a nice excuse to justify to yourself why you invested all that time in the past (it was a different game!) or to try to not save face with your internet baseball friends who you fear are judging you for abandoning the thread that brought you together in the first place.

* I am strongly opposed to expanded playoffs. Yet I find hand-wringing about the Astros advancing to the ALCS to be bizarre. Yes, I realize that the Astros carry with them baggage for reasons beyond their 2020 performance, but these lamentations are ostensibly grounded in the fact that they had a 29-31 regular season record.

The fact of the matter is that a sixty-game season is very much incapable of producing the same level of certainty about a team’s quality that a 162 game season can. It should not surprise anyone that a good team could have a sub-.500 record over a sixty games. As fiercely opposed to expanded playoffs as I am, the fewer games are played in the regular season:

a) the more justification there is for an expanded playoff field b) more importantly, the more a team’s performance in the playoffs should change our perception of their actual quality

When the 2006 Cardinals just barely scraped over .500 and went on to win the World Series, I would argue that their performance in the playoffs should have positively impacted our perception of their quality – but only slightly so. Their mediocre record spoke more to their quality than their eleven playoff wins. But if the Astros obtain comparable success, it should provide a much greater positive lift to our perception.

In the preceding paragraphs I have been discussing the matter as if the 2020 regular season was the only information we had by which to gauge the Astros true talent. Of course, this is untrue, and I would argue that the Astros are a good baseball team (even with the injury to Justin Verlander which couldn’t be factored into pre-season assessments) that had a poor sixty games. Another playoff team, one that will be a very trendy pick for 2021, that had the inverse of Houston’s record (31-29), is one to which I would make the opposite argument. The Miami Marlins are a bad baseball team that had a lucky win-loss record over sixty games despite playing like a bad baseball team. (Their Pythagenpat record, based on runs per nine innings, was only .431; based on runs created, only .417. I know some of you are screaming right now about the 29 runs allowed in one game, but of course you can’t just throw that out – perhaps it should be truncated, but it can’t be ignored). The Marlins on paper before the season projected to be one of the worst teams in the NL. I can’t imagine a better under bet on team wins for 2021.

Yet because of a measly two game difference in their records, the Astros get scorn for advancing, while a Marlins advance would have been treated as a heart-warming story. In my world, the inverse is true. There’s no team I wanted out of the playoffs more than the Marlins; while I would have preferred that the A’s had beaten the Astros, and would prefer the Rays to do so, Houston’s success to date is a fantastic troll job of some very odd ways to think about baseball.

* Warning: what follows is not sports-related, and I don’t presume anyone reading this blog is here for anything other than my opinion on sports. The thoughts in this post would have been better expressed succinctly on a platform like Twitter, but I can no longer in good conscience use Twitter – it’s been two years since I tweeted regularly and a few months since I completely deleted my account.

Ostensibly, social media platforms like Twitter exist to facilitate free speech; in practice, regardless of whether it is/was the intent of their creators (and it now seems quite clear that it is the current intent of their owners), they serve as a mechanism for the suppression of free thought. It is their prerogative to do so (although I do not believe for one moment that this recognition of principle would be reciprocated), and it is my prerogative to refuse to use their service. I realize that I am writing this on a Google platform; the only thing I can say is that the value proposition of a free blogging platform makes getting in bed with the devil more attractive than getting in to participate in the cesspool that is Twitter circa 2020.

Monday, September 30, 2019

Crude Playoff Odds -- 2019

These are very simple playoff odds, based on my crude rating system for teams using an equal mix of W%, EW% (based on R/RA), PW% (based on RC/RCA), and 69 games of .500. They account for home field advantage by assuming a .500 team wins 54.2% of home games (major league average 2006-2015). They assume that a team's inherent strength is constant from game-to-game. They do not generally account for any number of factors that you would actually want to account for if you were serious about this, including but not limited to injuries, the current construction of the team rather than the aggregate seasonal performance, pitching rotations, estimated true talent of the players, etc.

The CTRs that are fed in are:


Wilcard game odds (the least useful since the pitching matchups aren’t taken into account, and that matters most when there is just one game):


LDS:


LCS:


WS:


It was easier to run this when World Series home field advantage was determined by league rather than team record. The record approach is not as arbitrary as alternating years or as silly as using the All-Star game result, but it does produce its own share of undesirable outcomes. Houston would have home field over Los Angeles, but given that the NL was finally stronger than the AL this year, the Astros' one game edge suggests an inferior record to that of the Dodgers, not a superior one. Even worse are the tiebreakers - after head-to-head, the edge goes to the team with the better intradivisional records favors teams from weak divisions, who likely performed less well than their raw win-loss record would suggest. The same is true of intraleague record which is the next tiebreaker. If some division/league breakout is the criteria of choice, it should be inter-, not intra-.

Putting it all together:


Monday, October 01, 2018

Crude Playoff Odds -- 2018

These are very simple playoff odds, based on my crude rating system for teams using an equal mix of W%, EW% (based on R/RA), PW% (based on RC/RCA), and 69 games of .500. They account for home field advantage by assuming a .500 team wins 54.2% of home games (major league average 2006-2015). They assume that a team's inherent strength is constant from game-to-game. They do not generally account for any number of factors that you would actually want to account for if you were serious about this, including but not limited to injuries, the current construction of the team rather than the aggregate seasonal performance, pitching rotations, estimated true talent of the players, etc.

The CTRs that are fed in are:


Wilcard game odds (the least useful since the pitching matchups aren’t taken into account, and that matters most when there is just one game):


LDS:


LCS:


WS:


Because I set this spreadsheet up when home field advantage went to a particular league (as it has been for the entire history of the World Series prior to this year), all of the AL teams are listed as the home team. But the probabilities all consider which team would actually have the home field advantage in each matchup. Incidentally, the first tiebreaker after overall record is intra-divisional record, which if anything should favor the team with the worse record but would amusingly give Cleveland home field advantage in a series against Los Angeles or Colorado.

Putting it all together:

Monday, October 02, 2017

Crude Playoff Odds--2017

These are very simple playoff odds, based on my crude rating system for teams using an equal mix of W%, EW% (based on R/RA), PW% (based on RC/RCA), and 69 games of .500. They account for home field advantage by assuming a .500 team wins 54.2% of home games (major league average 2006-2015). They assume that a team's inherent strength is constant from game-to-game. They do not generally account for any number of factors that you would actually want to account for if you were serious about this, including but not limited to injuries, the current construction of the team rather than the aggregate seasonal performance, pitching rotations, estimated true talent of the players, etc.

The CTRs that are fed in are:


Notable here is that three AL teams rank ahead of the Dodgers, which includes New York rather than Boston. NYA’s raw EW% and PW% are very close to LA, and LA played the second-weakest schedule in MLB while the Red Sox and Yankees played the toughest schedules of any playoff teams.

Wilcard game odds (the least useful since the pitching matchups aren’t taken into account, and that matters most when there is just one game):


LDS:


I think most people would pick WAS/CHN as the most compelling on paper, which is backed up by the odds. Unfortunately for me, CLE/NYA would be a sneaky-good series.

LCS:


World Series:


Because I set this spreadsheet up when home field advantage went to a particular league (as it has been for the entire history of the World Series prior to this year), all of the NL teams are listed as the home team. But the probabilities all consider which team would actually have the home field advantage in each matchup.

Put it all together:


This one should make it clear why I don’t have much to say this year.

Monday, October 03, 2016

Crude Playoff Odds--2016

These are very simple playoff odds, based on my crude rating system for teams using an equal mix of W%, EW% (based on R/RA), PW% (based on RC/RCA), and 69 games of .500. They account for home field advantage by assuming a .500 team wins 54.2% of home games (major league average 2006-2015). They assume that a team's inherent strength is constant from game-to-game. They do not generally account for any number of factors that you would actually want to account for if you were serious about this, including but not limited to injuries, the current construction of the team rather than the aggregate seasonal performance, pitching rotations, estimated true talent of the players, etc.

I say “generally” since this year, the team I am a fan of (Cleveland) lost two key starting pitchers, and I wanted to account for that in the ratings. While other teams have injuries of note as well, I did not consider those. This approach is basically being as conservative as reasonably possible in estimating the Indians strength. Using a runs allowed approach (and not adjusting for bullpen support and park factor because I haven’t had time to dig into the numbers yet) Carlos Carrasco and Danny Salazar combined for about 5.9 WAR, which over 161 games is a .037 hit to the Indians’ W%. Of course, the real impact is not necessarily equal to the WAR impact; generic replacements don’t apply and the impact of starting pitchers in the playoffs can be muted. Still, this adjustment is better than nothing. I should also note that not park adjusting is mildly conservative since Cleveland tends to be a pitchers park.

Knocking .037 points off of Cleveland’s three W% metrics, the resulting CTRs are:


One thing to note here is just how good Boston is assumed to be; they were excellent in the W% estimators. The Cubs were even better in each of those metrics their 103 wins would suggest, but the Red Sox close the gap on strength of schedule, 104 to the Cubs’ 93 (implying that Boston’s average opponent would have a .528 W% against Chicago’s average opponent). With the injury adjustment the Indians are the weakest team on paper, but not so much so that they have significantly lower odds (last year, the Mets at 104 were the lowest-rated team and we know how that worked out).

Wildcard odds are the least useful, since it is the round where pitching matchup has the biggest effect:


Since we’re assuming the home team wins 54.2%, there’s very little difference in assumed strength in these two matchups (of course, the Mets suffer from even more extreme pitching maladies than do the Indians).

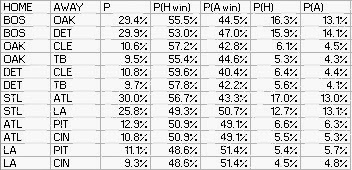
In the charts that follow, “P” is the probability that the series occurs; P(H win) is the probability that the home team wins should the series occur; and P(H) is the probability that the series occurs and that the home team wins [P*P(H win)].

LDS:


My guess, based on no calculations but including my inherent knowledge of the team’s statistical records and characteristics, was that Cleveland would have a 45% chance against Boston. So strike one for homerism there. Texas/wildcard figures will be the closest DS matchup on paper, although I’m most eager to see WAS/LA (other than the Indians, of course).

LCS:


You’ll note that the Cubs have a higher probability against stronger teams than they do in the NLDS thanks to the extra games. Cubs/Dodgers is the most lopsided potential LCS, while Dodgers/Mets is the closest.

World Series:


The AL is favored in 13 of the 25 possible matchups, but 13 of 20 that don’t involve Chicago. It doesn’t help the stronger circuit that it’s two highest seeds have the two lowest CTRs in the field.

Putting it all together:


This gives the NL a 51.1% chance to win, a 84% chance of an outcome I like, a 79% chance of an outcome I really like, and a 7.9% chance of an outcome that would be the best thing that’s ever happened in baseball. Plus a 100% of being a better outcome than 2015.

Monday, November 02, 2015

Royal Mythology

Rarely has the performance of a single team led to so many attempts to rationalize, explain, project virtue, and the like as the 2014-15 Royals. Focusing on the 2015 edition, here are just a handful of Royals myths that I have been particularly annoyed at hearing. The "analysis" that follows is not comprehensive nor is it intended to be. That's kind of the point. The level of extraordinary claims that have been made about the Royals should be apparent even with the crudest of inquiries into the objective record.

Myth #1: Whatever the Heck Andy McCullough Tweeted

"The entire point of the Royals is that baseball is a hard game and if you make your opponent do things, sometimes they will screw up"

The Kansas City Royals reached based on error 58 times in 2015. The AL average was 57. In 2014 they had 51 ROE versus a league average of 57.

Myth #2: The Royals Don't Make Mistakes

Errors leave a lot to be desired as a metric, but when traditional thinkers talk about making mistakes, errors are first and foremost on their mind. The 2015 Royals had a mFA of .973; the AL average was .971. The 2014 Royals had a mFA of .968; the AL average was .970.

Myth #3: The Royals had a long World Series drought

There are 30 MLB teams. It should be obvious, then, that 30 years is the expected time between world titles. Thus a streak of thirty years is not particularly long in theory. It's also not long in practice, as it was only the 12th longest drought (the Mets had the 13th longest drought). Last year en route to the pennant, two of the three teams Kansas City beat had (slightly) longer droughts and the other had a slightly shorter drought.

To find the Royals worthy of any particular sympathy, one must give extra credit for how poorly the franchise performed for much of that period. While this is unfortunate for the fans, it seems like such a group would be less traumatized by losing the World Series and more appreciative just to get there. Fan "suffering" is very low on my list of factors in deciding which teams to pull for in the playoffs, but to the extent I consider it, I tend to side with teams that have been good and just have not had the bounces go their way in October. Teams like the Marlins and the Royals who parlay their only two playoff teams in an extended period into pennants and world titles are quite galling to anyone who has rooted for a titleless yet competent franchise.

But more broadly, I think that the media and fans have yet to understand how championships will be distributed over the long haul in leagues that are double or close to it in size from what they were for so many years. Lengthy droughts, the types that the Red Sox, Cubs, or to a lesser extent Indians and Giants have suffered will be quite commonplace. Basic logic tells you that they have to be.

I did a "simulation" (which is a pretentious way of saying I used the RAND() function in Excel) to simulate 1,000 seasons of a thirty-team league in which each team had a 1/30 chance to win the World Series in any given year. Remember, this is the height of competitive balance. The probability of a championship could not be any more evenly distributed. There are no market disadvantages, no bad franchise stewardship, no billy goats. It is theoretically possible that the timing of championships could be more evenly distributed, but admittedly my imagination is insufficient to describe a specific scenario that would force a more even temporal distribution.

After 1,000 years, the average team should have had 33 1/3 titles. The most successful had 45; the two least successful each had 22 (as an aside, and granting that it was a sixteen team universe for an extended period, think about the Yankees' 27 in this context).

For years 501-1000, I calculated the average of the quartiles, as well as the percentage of active droughts as of a given year greater than 30 years. Since droughts for these 500 years are not independent of one another, be cautious with extrapolating those averages to anything else (for what it's worth, the medians are similar).

The average for these seasons was a first quartile drought of 8.4 years; a median drought of 20.2 years; a third quartile drought of 39.8 years, and a maximum drought of 115.0 years. In the average season, 34.4% of droughts exceeded 30 years (note that the current MLB figure is 12/26 = 46.2% of droughts exceeding 30 years, excluding the four subsequent expansion franchises, which suggests but in no way proves that, not surprisingly, the observed title distribution is not as egalitarian as the theoretical one used here).

Freezing it at year 1,000, this is what the drought picture looks like:


Even with new champions in 7 consecutive and 16 out of 20 seasons, a pretty typical 1/3 of droughts exceed 30 years, one team has exceeded the Cubs, and two more have exceeded the Indians.

The longest drought for any team during the millennium was 215 years. The poor fans of Team 6 celebrated a title in year 306, then went through many generations (or not, who knows, it's the future) before finally winning again in year 622. Then they waited another 120 years for good measure. Should baseball survive for 1,000 years with 30 or more teams, think about all of the narratives that the sportswriters of the future will get to craft.

Myth #4: The Royals Need to Be Explained

This is more of a meta-analytical comment than specific to the Royals, but there is an underlying notion, seen even on some sabermetrically-inclined outlets, that the Royals are an anomaly that demands our attention and an explanation. Please note that I am not criticizing the act of questioning ones premises, of attempting to update hypotheses as new data becomes available, of recognizing that we don't know everything about baseball, or anything of the sort. This all laudable. But such inquisition must not be confused with an imperative to find fault in one's null hypotheses either.

But there all too often is a reflexive desire to be too conciliatory, too eager to throw out one's existing knowledge and toolkit in an attempt to explain something that may just be a fluke. Witness "The Year That Base Runs Failed" (an article that demands a thorough undressing that I just do not have the will to give justice to right now). Recently this has seemed to manifest itself more at outlets that rely on 1) boisterous, opinionated writers and 2) daily content production.

When you are boisterous and opinionated, you need your opinions to be right in order to maintain credibility. If you have to blame the tools (Base Runs, W% Estimators, the entirety of sabermetric theory) that you used to justify your initial opinion, that's fair game. On the other hand, my position on the Royals doesn't demand I apologize for it (maybe I should--as I acknowledged above, I could be wrong, and inquiry into why that might be the case is healthy). My position is simply that the Royals were a fairly average team as indicated by their component statistics, but that sometimes teams outplay their component statistics. The Royals made the playoffs and over two seasons went 22-9, but a .500 team would go 22-9 or better with 1.5% probability--it's not likely but it also must happen now and again. You can disagree, but it's inherently a passive argument.

If you need to produce content daily, then you have to write about something, and writing "the sample size precludes us from drawing firm conclusions" over and over again doesn't drive readership. So there's a temptation to overfit your model, to declare that the secret sauce has been found, to cheat on the degree of certainty you require before you declare correlation to be causation, to investigate one positively correlated variable at the expense of other potential explanatory variables, to overreact to a year in which your metric's standard error is higher than it typically is.

Even great sabermetricians can get caught in this trap, and I have never been confused with a great sabermetrician but I have written things along these lines that I am not proud of as well. Bill James and Nate Silver have both, using different but understandable means when considered in the context of their work, failed pretty miserably at predicting playoff success based on historical data. The simple fact of the matter is that there were 32 playoff games (not counting the wildcard games) this season, which is fairly typical. At 30 games/season, you need five seasons to have a sample size the same as that of one major league team-season.

This is particularly problematic when so many of the attempts to explain playoff performance are based on theories about changes in the game. Contact superseding Moneyball, bullpen construction and usage patterns which have been in a constant state of change throughout baseball history...you could never have credible data without the conditions of the game shifting. This is not to say don't try to advance our understanding, it's to say be extremely cautious as you attempt to do so.

So what winds up happening is that a potential explanation ("Contact works, allow it" is a particularly poor paraphrase since it makes it sound like your pitchers should allow contact, but I saw that Colin Cowherd promo to many times not to use it) is honed in on, and maybe there's evidence of some effect, so other potential explanatory variables are ignored and the correlation is exaggerated and soon there's a truism that must be disproved rather than a hypothesis which must be proved.

There's a difference between saying "I don't know" and "No one will ever know". If it seems as if my school of thought arrives at the latter, that's a fair criticism. But I personally would rather be too certain about how much I can't know than to be too quick to think I've learned something new.

Monday, October 05, 2015

Crude Playoff Odds--2015

These are very simple playoff odds, based on my crude rating system for teams using an equal mix of W%, EW% (based on R/RA), PW% (based on RC/RCA), and 69 games of .500. They account for home field advantage by assuming a .500 team wins 54.5% of home games. They assume that a team's inherent strength is constant from game-to-game. They do not account for any number of factors that you would actually want to account for if you were serious about this, including but not limited to injuries, the current construction of the team rather than the aggregate seasonal performance, pitching rotations, estimated true talent of the players, and whatever Ned Yost sold to the devil.

These are the ratings that fuel the odds (CTR(H) is the team's rating with home field advantage included):


You'll note that the ratings love Houston much more than anyone else. thanks to their excellent EW% and PW%. The league disparity remains strong, with the average AL team (not playoff team) having a 107 rating with 100 being average. To the extent the ratings look odd, that is probably the largest driver; another is the fact that the NL East and West were the weakest divisions in MLB, so LA's SOS ranks 28th and NYN's ranks dead last. The Mets' average opponent is considered to be about equal to the White Sox; the Yankees' (who played the toughest schedule of any playoff team) is considered to be about equal to the...wait for it...Mets (actually, better than the Mets, 106 to 104).

The wildcard odds:


Very even matchups that actually slightly favor the visiting teams (remember, home team is assumed to win 54.5% if equal).

In the charts that follow, “P” is the probability that the series occurs; P(H win) is the probability that the home team wins should the series occur; and P(H) is the probability that the series occurs and that the home team wins [P*P(H win)].

LDS:


The series I was most interested in without looking at any numbers was NYN/LA; while it still ranks as pretty competitive, it's the least competitive on paper other than TEX/TOR. Surprisingly (but thankfully), KC should have their hands full every step of the way, although obviously wildcards burning off their pitchers is not accounted for here.

LCS:


The home team is favored in every LDS matchup, but that is decisively not the case here, with seven of the twelve possible LCS matchups featuring road favorites. This is due to the NL's top teams all hailing from the Central as the winner of STL/wildcard will be favored in any LCS matchup, along with TEX being considered the AL's weakest playoff participant but having home field should the wildcard knockoff KC.

World Series:


The NL is favored in just four of twenty-five possible matchups, namely those that feature the Rangers against not-the-Mets. STL is considered stronger than KC or NYA by the ratings, but home field advantage tips the odds to the junior circuit.

Putting it all together:


There's a 75% chance the World Series will be sufferable, which I think is decent. The AL has a 56.4% chance to win.

I lost a lot of Twitter followers last year by griping about the playoffs, particularly the Royals. So be it. The 2014 playoffs were the least enjoyable of my time as a fan. One factor was that the series weren't very good--there were a lot of sweeps and the like, until a terrific World Series. It wasn't extraordinarily bad in that respect, but there were fewer games than usual. There were a lot of very good individual games (at least until the World Series, which had an epic game seven that has washed away how blah most of it was out people's memories), but I'd prefer a better balance of series and game drama.

But what really irked me about the 2014 playoffs is how predictable they were. Many people praised the playoffs for their unpredictability, but I contend that in retrospect they were quite predictable in retrospect--the better team lost. Obviously the very existence of playoffs allows for the regular season results to be voided by short series results; too much so for my liking, as in my ideal world there would be four or two playoff teams (i.e. either 1969-1993 or pre-1969 format). The trend of history in every American sport is inexorably to further expand the playoff field.

I am fully aware of both of those facts--that short series often result in the lesser team winning, and that the playoffs are never going to be reduced in size. Accepting that reality does not, however, compel me to enjoy that reality, and I did not enjoy watching the better teams get beaten as a matter of course last October. I also find the style, attitude, and fan/media entitlement of the Royals to be insufferable, and thus I was particularly perturbed by the results.

At the risk of beating that dead horse, further points in my defense of my hatred of the 2014 postseason:

1. The better team almost always losing should not be what people mean when they say they like unpredictability in the playoff outcomes. That would involve the better team sometimes winning. It became very easy to predict (not with any assurance or confidence of accuracy in the moment, of course; I'm not suggesting the universe inevitably set the better teams to be defeated) the 2014 playoffs in short order after the horrid first set of games that saw three of four series go 2-0.

2. The Royals simply don't play the style of baseball I like. That's just my preference, not a sabermetric imperative or anything weighty like that, but I personally do not enjoy watching low secondary average baseball. Of course, the Royals started hitting home runs in the playoffs, so they were winning in large part due to the inverse of the narrative they were used to advance.

3. I don't begrudge anyone rooting for their team. Certainly I root for the Indians unequivocally when they are in the playoffs whether they are the best team or not. But it became really tiresome to hear about the Royals long playoff drought. I certainly do not believe that franchises are owed success thanks to fallow periods, but if I did, I would have started the list of worthy playoff participants elsewhere. After all, KC's drought was simply that they had gone thirty years without making the playoffs at all. They made the playoffs, they advanced from the wildcard round, they were in the playoffs. Why did that drought entitle their fans to more? The Tigers, Orioles, and Pirates all had longer World Series title droughts than the Royals. If people choose who to root for based on past suffering, the line should start there once you've advanced to the playoffs. There are a lot of fans of a lot of teams who have seen their teams make the playoffs multiple times and break their hearts once there, and they're supposed to pull for KC to win in their first shot? And while a thirty year playoff drought is excessive, a little bit of simple logic should tell you that given that there are thirty teams, thirty year world title droughts are not going to be even remotely remarkable in the future.

Hopefully this will be the last time I have occasion to rant about the 2014-15 Royals. May the Astros or Yankees do to them as they did to the Angels.

Monday, September 29, 2014

Crude Playoff Odds--2014

In a world where there are plenty of sources for playoff odds that actually take into account the personnel currently available for each team, use projected rather than 2014-only performance, consider pitching matchups, and the like, there is no real reason for me to post this. Nonetheless, here are some very crude playoff odds. The key assumptions:

• Team strength is constant and is measured by my Crude Team Ratings, using an equal weight of W%, EW%, and PW% regressed with 69 games of .500
• Home field advantage is uniform and the home team wins 54.5% of the time

From there, the math is pretty simple and I will present with little explanation. First, the ratings which are used to feed the estimates:


These ratings don’t know or care that Oakland has stopped scoring runs (or that the magic influence of Cespedes is gone); they don’t know that Garret Richards is injured; they don’t know anything other than these team’s schedules, their wins and losses, runs and runs allowed, and BA/OBA/SLG and allowed.

From here, it’s just plug and chug. Wildcard game odds:


Home field offsets OAK’s perceived strength advantage over KC.

Division series:


Here, “P” is the probability that the series occurs; P(H win) is the probability that the home team wins should the series occur; and P(H) is the probability that the series occurs and that the home team wins [P*P(H win)].

LCS:


World Series:


The probability of one of the “rivalry” matchups (OAK/SF, LAA/LA, BAL/WAS, or KC/STL) occurring is 21.5%, which is not bad at all. LAA/LA is the second-most likely series; the least likely is KC/SF, which is good because that is the one that I would least like to see.

Putting it all together:


One might be surprised by OAK having better odds to win a Division Series and each subsequent round than KC even though the latter is favored in their wildcard game, but the ratings (perhaps incorrectly) think the A’s are one of the strongest teams in the playoffs, and thus the Royals wild card game edge, solely due to home field, is insufficiently large to keep them ahead. KC would need a rating of around 122 to have an equal World Series win probability to the A’s.

The odds suggest a 57.6% chance that the junior circuit wins it all, not a surprise given that the AL teams rank 1-2-3-6-7 in strength and they have home field in the World Series to boot. In fact, the AL is favored in 22 of 25 potential matchups, with the only exceptions being Washington against Detroit or Kansas City and Los Angeles against Kansas City.

Tuesday, October 01, 2013

Crude Playoff Odds

In a world where there are plenty of sources for playoff odds that actually take into account the personnel currently available for each team, projected rather than 2013-only performance, pitching matchups, and the like, there is no real reason for me to post this. Nonetheless, here are some very crude playoff odds. The key assumptions:

  • Team strength is constant and is measured by my Crude Team Ratings, using an equally weight of W%, EW%, and PW% regressed with 69 games of .500 
  • Home field advantage is uniform and the home team wins 54.5% of the time

From there, the math is pretty simple and I will present with little explanation. First, the ratings which are used to feed the estimates:


You may be surprised to see the Dodgers as the weakest playoff team in the ratings, but the NL West was not a strong division and the Dodgers' SOS in the ratings is just 28th, ahead of only Washington and Atlanta. LA ranks 11th in MLB in the ratings, with the ten teams ahead all being in the playoffs except for #8 Texas.

Odds for the wildcard games:


For the Division Series:


For the LCS:


For the World Series:


110-1 for a Cincinnati/Cleveland series.

Put it all together:

Thursday, October 04, 2012

Playoff Meanderings

* I always like to write a little something about playoff odds. The playoff odds that I publish are not intended to be the most accurate. They incorporate only full seasonal team data, haphazardly thrown into a weighted average. They assume that win probabilities are constant from game to game. There are other nits I could pick, but those are the huge ones.

So why bother? The main goal is to once again make the point that attempting to predict playoff outcomes is largely a fool’s errand. This is probably an obvious point to anyone who reads this blog, but it is one that I feel compelled to come back to each October regardless.

The methodology here was to use my crude team ratings--based on estimated win ratio and adjusted for strength of schedule. I figured three sets of these--based on actual wins and losses, based on runs scored and allowed, and based on runs created and allowed. Then I combined them and built-in some regression to the mean, with no real rhyme or reason to the weighting (the win ratios fed into the rating are based 30% on actual record, 30% on R/RA, 20% on RC/RCA, and 20% on .500).

These then go into this spreadsheet, which calculates the probability of a team winning a playoff series using Log5 and an assumed home field winning percentage of .545 for a .500 team. First, here are the ratings for each of the playoff teams:


As you can see, the rating system still believes that the AL is superior to the NL (the overall AL rating is 106 versus 95 for the NL). Baltimore comes out better than I expected, and it is worth remembering that playing in the AL East means that their schedule was very tough (after the season, I’ll have a post with full rankings). You may be surprised to see Cincinnati so low, but they exceeded their expected W%s by a fair amount and along with St. Louis were the strongest teams in the weakest division, meaning they faced the easiest schedules in MLB.

Feeding those rankings through the playoff odds spreadsheet, here are the crude playoff probabilities:


I would suggest that Oakland and Washington are the teams that benefit the most from the crude nature of this approach. No team has much better than a 1 in 3 chance of winning the pennant, which is typical but completely out of line with the mainstream notions of anointing favorites. It should come as no surprise that the four wildcards rate as having the lowest odds, but it’s worth noting that the wildcards combined have a higher estimated probability of winning the World Series than the #3 seeds in each league.

Whichever team comes out of the wildcard game will be in decent shape, although as the media will remind you many times will be a bit disadvantaged in their starting pitching options for the Division Series. Here are each of the wildcard’s probabilities assuming they win the game (again, with no penalty for fatigue):


Collapse aside, Texas remains one of the strongest teams on paper. Atlanta compares favorably to Cincinnati or San Francisco, and both Baltimore and St. Louis have respectable chances (in fact, the Cards 8% is better than their 7% from a similar methodology last year).

* The 2-3 Division Series format is already being set up as a ready-made excuse for any of the higher seeded teams that lose. I’m not saying it’s the optimal format, but the importance of having the first two games at home can be overstated. Of course, the model I’m using here can’t account for any psychological effects, but there is no difference in the expected outcome of the series as long there are three home games scheduled.

Theoretically, assuming evenly matched teams in each game of a series, 37.5% of five-game series should go the distance and only 25% should be sweeps. But empirically, 41 five-game series since 1969 have been sweeps, while only 27 have gone the distance. Of course, those empirical results include teams that benefitted from jumping up 2-0 at home.

While the 2-3 format is not ideal, and offers the possibility of what I call a reverse home field advantage (the lower seeded team actually playing more home games), I don’t see any reason to accept it as an excuse. A couple of the higher seeded teams will probably lose, but that happens in typical seasons as well.

It’s also worth noting that a 2-3 format has been used before, most recently in 1995-96. In those two seasons, the cross-divisional matchups were pre-determined. In 1995 for example, the 100-44 Indians opened against the 86-58 Red Sox with two games at Jacobs Field and the final three games schedule for Fenway Park (Cleveland swept). Meanwhile, the 79-66 Mariners played the 79-65 Yankees. The 2-3 of 2012 may be a mild annoyance, but playoff formats have previously reached colossal levels of stupidity to which it can only aspire.

* For the last few years I have also expressed my playoff rooting preferences. There’s no reason why you should care, but it’s good to get it off my chest.

Would be happy if they win: Yankees, A’s, Reds, Nationals, Braves
Would be indifferent if they win: Rangers, Cardinals
Would be annoyed if they win: Orioles, Tigers, Giants

So expect a BAL/SF World Series (1.8% chance based on the crude odds).