
Counting is hard.
Occasionally sabermetrically-inclined people will get behind a Hall of Fame candidate, generally one who has overwhelming qualifications from one perspective or another, but for whatever reason don't resonate as well with the mainstream. Rich Lederer's tireless campaign for Bert Blyleven is the most prominent (and successful), and the Tim Raines group of Jonah Keri, Nate Sager, Tango Tiger, and the late John Brattain has put together a website for their now Andre Dawson-endorsed cause. Alan Trammell certainly has his advocates, although they are not nearly as well-organized. Both Robbie Alomar and Barry Larkin debuted with a high enough percentage that there's no particular sense of urgency to make their case.
Blyleven is very likely to be voted in 2011, which should free up some people's quota of HOF arguing time. I have an early suggestion for you on where to invest it, if you're into that sort of thing. It's quite possible that I'm off-base, and that this player will be viewed more favorable by the BBWAA than I imagine. I admittedly don't have a particularly good handle on the mainstream baseball consensus.
Perhaps it's a sign of how out of touch I am that the comment I'm about to describe even raised my eyebrow. Tom Hamilton, the Indians' play-by-play announcer, described this player as a guy who "might be a borderline Hall of Famer". Had it just been "might" or "borderline", I probably wouldn't have thought as much of it, just chalking it up to laziness. But "might" and "borderline"? As in, "If this guy gets in, he's still more like Jim Rice than Carl Yastrzemski"?
Before I go any further, it must be acknowledged that this player performed in the 90s-00s, and thus will be written off by many because of steroids. So be it; there's no changing any minds on that issue.
The player I speak of is Jeff Bagwell, and he'll be on the ballot for the first time this year. I'm suggesting that if you would like to be the next Rich Lederer, you should get a head start. The day the vote is taken, the blogosphere will be overrun with posts about how badly the BBWAA missed on Bagwell. This is your chance to get ahead of the curve and stake out your territory.
From the sabermetric perspective, it's hardly worth even making the case for Bagwell. He ranks 35th all-time among position players in Chone's WAR, essentially equal with Ken Griffey. The only post-1900 first baseman ahead of him are Gehrig and Foxx (the great ABC trio of the nineteenth-century also ranks ahead of Bagwell). My own figures agree with that assessment. His peak seasons (probably 1994, 1996-1999) are impressive.
However, it's not too difficult to see why Bagwell might be underappreciated by the mainstream. Among the explanations:
1. While Bagwell compiled impressive triple crown numbers during his big seasons, he was a big secondary average guy who looks even better through the lens of advanced metrics. As you'll see below, his adjusted runs scored and RBI rates are much closer to equal than many other great first baseman, and RBI get all the attention (which is not to suggest that Bagwell's RBI rates were anything but outstanding).
2. Bagwell's best season, 1994, was shortened by a hand injury and the strike. The strike was probably fortuitous in his case, as he would not have been the NL MVP had the season continued with him out of action. I'm not suggesting that his 1994 be counted as a full season, and I don't think he requires any dispensation for it. Without it, though, he's missing what would have been a monster season around which to build his case.
3. The end of Bagwell's career was cut short by shoulder problems. His last full season came at age 36, one in which he was still an above-average performer and hit 27 homers. Without injury, it's a pretty safe assumption that he'd have reached 500 homers.
Of course, he didn't, and again I'm not suggesting that he should be credited for doing so. However, getting to 500 would have given him one of the key milestones that shape mainstream perception of career value.
4. Bagwell spent his peak in a fairly strong pitcher's park. The Astrodome park factor ranges from 94-97 during his years playing there (1991-99). The erstwhile Enron Field was a hitter's park, driving Bagwell's career park factor up to a close-to-neutral 98, but the Astrodome disguised some of his peak value.
5. To some extent, Bagwell is associated with poor post-season performances, compiling a .226/.364/.321 line. One has to put a lot of stock in 129 PA to significantly change their evaluation of him on that basis, though.
Earlier this year, I looked at measures of runs and RBI per out relative to the league average. The point was not to suggest that these were superior to context-neutral metrics like runs created, but to put R and RBI totals in context, at least up to a sabermetric minimum (considering outs made and league scoring context). Bagwell's R and RBI, considered in this light, give a similar view of his value as advanced metrics.
Bagwell's runs scored per out relative to the league average (R+) was 153, which would rank fourth among post-1900 Hall of Fame first baseman, trailing only Gehrig, Chance, and Foxx. His RBI per out relative to the league (RBI+) of 163 is nearly as impressive; it would rank seventh, behind Gehrig, Greenberg, Foxx, Mize, McCovey, and Killebrew. The average of the two (which I called Runs Anything and abbreviated as ANY) is 158, which would rank fifth, trailing Gehrig, Greenberg, Foxx, and Mize.
I'll allow you to peruse the chart yourself and draw your own conclusions (or not, as the case may be), but I think it's fair to say that Bagwell's R and RBI figures are very much in line with the other great first baseman. Of course, ANY is not really a stand-in for mainstream analysis, despite being fueled by R and RBI. It does not fit that role, since it recognizes the fundamental principle of sabermetrics with respect to offense: that offense occurs within the context of outs.
When I have had occasion to discuss ranking players with non-saberites, I have often said something like "I'll accept for the sake of argument that R and RBI are appropriate measures of a player's offensive production." However, I refuse to waver on insisting that league context and outs be considered. In the case of Bagwell, league context is not a particularly important factor either way--the NL average R/G of 4.57 for his career is fairly normal. His OBA was outstanding, though, even when compared to great first baseman of history.
It's possible that I'm wrong, and that Bagwell is appreciated by the BBWAA voters and will debut at a percentage that makes future induction a solid bet. If so, any would-be Bagwell Lederers out there will have wasted their time and I will have cried wolf. I'd like for that to be the case, for Bagwell's sake if nothing else.
Bagwell and some other first basemen:


For those of you who have not seen it, the new site The Baseball Gauge (operated by "Railsplitter") has an impressive database of Win Shares, Win Shares Above Bench, and WAR figures for the entirety of major league history. There are a lot of different ways to view the data and I suggest you check it out.
The methodology used to calculate WAR on that site has been discussed at The Book Blog, and I believe that the method used to figure Fielding WAR is based on a faulty conversion of Win Shares to WAR. It's an easy trap to fall into with Win Shares.
To illustrate the Win Shares replacement trap, I'll focus on Offensive Win Shares (OWS is much more straightforward and easily comparable to other metrics like RAR that Fielding WS), but the principle applies to hitting, pitching, and fielding WS.
Suppose you have a league in which there are 25 outs per game and the average team scores 5 runs per game. An 81-81 team that scores and allows 5 runs per game in this league will get credit for 40.5 OWS (assuming the use of 50/150 as the WS margins rather than 52/152 in the original version, and ignoring James' scalar of "3", which is cosmetic and would only serve to complicate comparisons to other metrics in this case).
Suppose this team has no players who contribute "sub-marginal" runs. Then the Win Shares margin is at 5*.5 = 2.5 RG, and this team will have a total of 2.5*162 = 405 marginal runs, meaning 405/40.5 = 10 marginal runs/win. Suppose that this team has four players whom we are interested in, all making 350 outs. One creates 100 runs, another 80 runs, another 70 runs (which happens to be league average), and the last 57.75 (which is 82.5% of the league average, which is defined as the replacement level in Railsplitter's system).
A marginal player will have 2.5 RG, which is 35 runs/350 outs, so we simply subtract 35 to find marginal runs and 57.75 to find RAR. To convert to Win Shares or WAR, we can divide by 10 runs per win:

So we now know exactly what WAR should be for each player. Can we produce the same results by looking only at Win Shares? Railsplitter's approach would be to find the WS produced by an average player (we know this to be 3.5) and multiply by the replacement level (.825): 3.5*.825 = 2.8875. So, we can subtract that 2.8875 from each player's OWS to get our second WAR estimate (WARx):
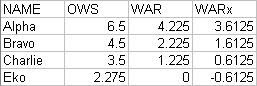
As you can see, this doesn't work. The differences between players are constant; Alpha is still two wins better than Bravo, who is one win better than Charlie, who is 1.225 wins better than Eko. But the scale is off; everyone is less valuable than we know them to be. Eko, who defines replacement level, is sub-replacement level. Everyone is .6125 WAR below where they should be.
This happens because we've now taken 82.5% of RC above 50% rather than what the replacement level is supposed to represent--82.5% of absolute RC.
This does not demonstrate that Win Shares cannot be converted to WAR (although it will fail for sub-marginal players if they are zeroed out, which is a feature of the original system but can be waived). It just shows that you have to figure a different percentage other than the one you are using.
Here, we know that the ratio of Eko/Charlie is equal to the replacement/average ratio, and it is 65% (2.275/3.5). How can we calculate this without going through the example?
Take the difference between the replacement level (.825) and the margin (.50), and divide by one minus the margin (1 - .5 = .5). This gives (.825 - .5)/(1 - .5) = .65, which we know is the right answer.
Suppose our replacement level was 70% rather than 82.5%. The replacement level in terms of win shares would be (.7 - .5)/(1 - .5) = .4. A different replacement level player, Foxtrot, would create 49 runs, and as you can see, using 40% as the new OWS replacement values matches WAR for this case as well:

One can convert Win Shares to a measure of value above replacement; you just have to keep in mind that the replacement level will be expressed differently as a ratio of win shares than as a ratio of runs created.
ADDENDUM: I forgot to show you what the actual effective replacement level is when one applies 82.5% directly to OWS. Solve this equation for x:
.825 = (x - .5)/(1 - .5)
x = .9125. Applying .825 directly to Win Shares is the equivalent of a "normal" replacement level of .9125, which is roughly a .455 W%--a very high effective replacement level.
The introduction of SIERA has triggered a lot of discussion about ERA estimators in the sabermetric community. This piece does not further that discussion; rather, it takes a step back and considers the choices made in constructing such metrics and sketches out a classification system for them.
I'm under no illusion that anyone is going to adopt the system and start referring to ERC as a ERD or xFIP as a EBS-R. My intent is simply to organize my thoughts on the various constructions and hopefully to prod you to do the same. As with so many sabermetric decisions regarding methodology, the choice of which metric to use is very much dependent on the question you'd like to answer. Hopefully this missive will help to clarify (at least in my own mind) the varying constructions of ERA estimators.
I have chosen four properties on which to base the classification system: what the formula estimates (earned runs or total runs allowed); what inputs the method takes (traditional results, defense-independent, or batted ball data); whether the weights placed on events in the formula are dynamic or static; and whether runs are estimated through a model of the scoring process, linear weights, or regression.
Delving into the properties individually:
1. Earned runs (E) or total runs allowed (T)
A system that produces an estimate in earned runs (or ERA) will get an E code; those that estimate total runs get a T. This is pretty straightforward and needs no further explanation.
2. Result inputs (R), defense-independent inputs (D), or batted ball inputs (B)
Some of the categories used have a bit of overlap; batted ball inputs are defense-independent, but make a more restrictive grouping.
By result inputs, I mean traditional statistics: hits allowed, walks, strikeouts, and the like. Defense-independent inputs remove non-HR hits from consideration. Batted ball inputs can include walks, strikeouts, and hit batters in addition to batted ball types, of course.
3. Dynamic (D) or static (S) weighting
Any fully linear formula is static; any formula that involves interaction (to use SIERA's term) between events is dynamic. Generally, dynamic formulas in this category will be any that use a dynamic run estimator like Runs Created or Base Runs as its foundation, although there are two notable exceptions, both from Baseball Prospectus.
4. Regression-based (R)
As I describe it above, this category would cover whether the run estimator used was model-based (like RC, BsR, Markov models, etc.), used linear weights, or used regression. As such, it obviously would largely repeat the property of the metric covered by the third criteria. Additionally, regression is not a mutually-exclusive category, as both models and linear weight formulas could be at least partially regression-based. So instead, I'm just going to include a "-R" at the end of the classification for formulas that are regression-generated.
This is not intended to be a scarlet letter of any kind, but I can see where some readers might get that impression. I just think it is helpful to have a further understanding of where event weights are coming from and to distinguish between methods that get their dynamism from the run estimator used and which get it from conscious choices of the creator to add interactive terms--distinctions that would otherwise be glossed over by this classification system.
Now, I'll consider several component ERAs in common use in the sabermetric community and explain how this scheme would classify them. It is not intended in to be comprehensive in any way; it includes some of the most commonly used metrics and some that help to illustrate the shortcomings of my classification system:
Bill James' Component ERA: ERD
Component ERA estimates earned runs; it uses results (hits, walks, strikeouts, home runs, and the like) as its inputs; and it is based on a dynamic model of run scoring (Runs Created).
As you can see when it is put in practice, this classification system does not make any sort of judgment on the utility of the metric. I don't care for Runs Created, but it is still a dynamic run estimator. Any sort of result-based ERA estimator I'd propose would be based on Base Runs, but would still get the same "ERD" classification.
Tango Tiger's FIP: EDS-R
FIP is an earned run estimator that does not include non-HR hits and uses static weights (with a floating constant). The coefficients logically coincide to linear weights, but were regression-derived so I tack on the "-R" at the end of the code.
My own eRA: TRD & dRA: TDD
These two are "my own" only in the sense that I defined a specific name, formula, and abbreviation for them--otherwise, they simply use Base Runs to estimate RA, one using actual results and one assuming that balls in play become hits with the league average frequency and severity. No innovation on my part, just applying David Smyth's run estimator and Voros McCracken's theory. I have always preferred to look at total runs allowed rather than earned runs, and so I constructed metrics to estimate RA, using my preferred run estimator.
Dave Studeman's xFIP: EBS-R
xFIP illustrates a shortcoming of the R/D/B descriptions, as it only uses one batted ball component (league average for HR on FB), but I've included it in a group with other metrics that use multiple batted ball categories.
Graham MacAree's tRA: TBS
tRA is one of the rare metrics that estimates total runs allowed. It does so by considering all batted ball types at their actual linear weight values.
Peter Jensen's DIRVA: TDS
DIRVA is expressed in terms of runs above/below average, so it's not really an ERA/RA estimator in that form, although of course it could be converted into such.
Jensen's method also differs from many others here because it uses the actual play-by-play sequence. A pitcher's DIRVA is his run value prevented (based on the RE table) for defense-independent events, minus the run value prevented on defense-independent events for an average pitcher in the same number of innings. If you don't understand that sentence, that's because it's not very well written--please go read Jensen's explanation which is infinitely more coherent.
What makes DIRVA unique is that it considers sequencing, something that the other metrics ignore by estimating runs from scratch rather than taking advantage of play-by-play data. This property is not reflected in its code, and static is a questionable description of the weighting--the weights are static in that they are derived from a fixed RE table, but the weight of any given walk will depend on the base/out state in which it occurs, rather than the value of a walk being a constant as it is for other methods tagged with the "S" for static.
Nate Silver's Quick ERA: EBD-R
and
Matt Swartz and Eric Seidman's SIERA: EBD-R
Both metrics from Baseball Prospectus estimate earned runs using batted ball data with dynamic weighting based on regression results. Neither metric considers the complete spectrum of batted ball types--Silver only considers groundballs and Swartz and Seidman use the term (GB-FB-PU)/PA based on their research on the persistence of line drive frequency and the creators' belief that popups might well turn into flyballs in the future.
I've written a little bit about SIERA before, but the point I want to make here is that the "interactivity" which is one of the main selling points is not unique. The specific implementation of interactivity is--SIERA only looks at certain interactions (strikeout rate with itself, grounders less flies and popups per PA with itself, strikeouts, and walks). But interactivity itself is present in any metric based on a dynamic run estimator.
Consider an estimator based on Runs Created, which has a numerator of (H + W)*TB. Of course, that can be broken down further into:
(S + D + T + HR + W)*(S + 2D + 3T + 4HR)
If you foil that out, you get:
S^2 + 2SD + 3ST + 4S(HR) + DS + 2D^2 + 3DT + 4D(HR) + ....
There's interactivity everywhere. Every term in the A factor interacts with every term in the B factor. Of course, you might not actually want all of that interaction. Base Runs (and RC) work by homogenizing baserunner's starting locations, assuming that the score rate is constant regardless of whether a runner starts at first, second, or third. Obviously, that is false, but if you tried to work around that you would have a mess on your hands, and you would lose the benefit of using a formula rather than a more involved method like a Markov model.
The other thing that makes SIERA's interaction unique is that it is a regression equation; a lot of analysts just run linear regressions that don't include any interactive terms.
There's a lot more that could be written on this topic, specifically which class of methods is appropriate dependent on the purpose it is being used for and the emphasis placed on correlation with future ERA. A lot of that is squarely in the realm of opinion, though, and I'll spare you my thoughts for the time being. I believe that having a clear understanding of how each metric operates is a necessary first step in sorting through those more philosophical questions.
Henry from Bean's was kind enough to send me some material that their PR department has on LL Bean's scoring system, so this time you'll actually get to read a little more about the original rather than my interpretation of it. Here is his description of the material:
[T]hey have about a half-dozen of these scorebooks, all used by LL. I've attached some high-res scans. The most interesting is the Sox Yankees game that LL scored -- not actually a consequential game, I checked BR and the Sox were out of it in 62, but it's cool that at age 90, he stayed and scored through the end.
Actually, now that I think of it, I wonder if age wasn't part of the 'easy to score at night' thing, in which case it makes a little more sense -- a system of scoring like this would make sense for someone older who was having trouble seeing / writing. The scorebook itself would have been something that, published in 1954, LL put out when he was 82. To your point, he was a pretty impressive guy.
Only other point of trivia was that apparently he also created a scoring system and published a scorebook "especially adapted for Official Little League Baseball"., of which he was a big supporter -- he put a field right on our corporate campus that's still there and still in use.
I have attached two of the scans that Henry sent me. One is of the aforementioned Yankees/Red Sox game, and the other is a key of Bean's codes that was included in the scorebooks. Here is the link to the Retrosheet PBP of the Yankees/Red Sox game, in case you'd like to interpret Bean's scoring.

The Yankees won 1-0 on July 17, 1962 with a run in the eighth inning generated by the bottom of their lineup: Lopez, Boyer, and Tresh all singled. Mickey Mantle flew to center, drew two walks, and singled to right. The most notable future name in the Sox lineup, then just in his second season, Yaz hit into a double play (hard to make out on Bean's scorecard--I checked the Retrosheet account), struck out, grounded to second, and tripled to center. The triple to center led off the ninth, but Boston was unable to push him across as Malzone grounded to short, Runnels flew to center, and Clinton grounded to third.
And the scoring key:

Many thanks to Henry and the Bean company for sharing this material.

