These are very simple playoff odds, based on my crude rating system for teams using an equal mix of W%, EW% (based on R/RA), PW% (based on RC/RCA), and 69 games of .500. They account for home field advantage by assuming a .500 team wins 54.2% of home games (major league average 2006-2015). They assume that a team's inherent strength is constant from game-to-game. They do not generally account for any number of factors that you would actually want to account for if you were serious about this, including but not limited to injuries, the current construction of the team rather than the aggregate seasonal performance, pitching rotations, estimated true talent of the players, etc.
I say “generally” since this year, the team I am a fan of (Cleveland) lost two key starting pitchers, and I wanted to account for that in the ratings. While other teams have injuries of note as well, I did not consider those. This approach is basically being as conservative as reasonably possible in estimating the Indians strength. Using a runs allowed approach (and not adjusting for bullpen support and park factor because I haven’t had time to dig into the numbers yet) Carlos Carrasco and Danny Salazar combined for about 5.9 WAR, which over 161 games is a .037 hit to the Indians’ W%. Of course, the real impact is not necessarily equal to the WAR impact; generic replacements don’t apply and the impact of starting pitchers in the playoffs can be muted. Still, this adjustment is better than nothing. I should also note that not park adjusting is mildly conservative since Cleveland tends to be a pitchers park.
Knocking .037 points off of Cleveland’s three W% metrics, the resulting CTRs are:

One thing to note here is just how good Boston is assumed to be; they were excellent in the W% estimators. The Cubs were even better in each of those metrics their 103 wins would suggest, but the Red Sox close the gap on strength of schedule, 104 to the Cubs’ 93 (implying that Boston’s average opponent would have a .528 W% against Chicago’s average opponent). With the injury adjustment the Indians are the weakest team on paper, but not so much so that they have significantly lower odds (last year, the Mets at 104 were the lowest-rated team and we know how that worked out).
Wildcard odds are the least useful, since it is the round where pitching matchup has the biggest effect:

Since we’re assuming the home team wins 54.2%, there’s very little difference in assumed strength in these two matchups (of course, the Mets suffer from even more extreme pitching maladies than do the Indians).
In the charts that follow, “P” is the probability that the series occurs; P(H win) is the probability that the home team wins should the series occur; and P(H) is the probability that the series occurs and that the home team wins [P*P(H win)].
LDS:

My guess, based on no calculations but including my inherent knowledge of the team’s statistical records and characteristics, was that Cleveland would have a 45% chance against Boston. So strike one for homerism there. Texas/wildcard figures will be the closest DS matchup on paper, although I’m most eager to see WAS/LA (other than the Indians, of course).
LCS:

You’ll note that the Cubs have a higher probability against stronger teams than they do in the NLDS thanks to the extra games. Cubs/Dodgers is the most lopsided potential LCS, while Dodgers/Mets is the closest.
World Series:

The AL is favored in 13 of the 25 possible matchups, but 13 of 20 that don’t involve Chicago. It doesn’t help the stronger circuit that it’s two highest seeds have the two lowest CTRs in the field.
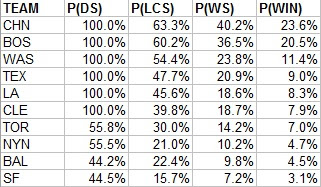
Putting it all together:

This gives the NL a 51.1% chance to win, a 84% chance of an outcome I like, a 79% chance of an outcome I really like, and a 7.9% chance of an outcome that would be the best thing that’s ever happened in baseball. Plus a 100% of being a better outcome than 2015.
Monday, October 03, 2016
Crude Playoff Odds--2016
Subscribe to:
Post Comments (Atom)
No comments:
Post a Comment
I reserve the right to reject any comment for any reason.