If you are interested in what follows, then you will want to read my post on magic numbers and "magic percentage". That's the background material for this post.
In that post, I discuss the standard magic number, which is the number of game outcomes a team needs to go its way to clinch a playoff berth. I also introduced what I called magic percentage, which is the magic number divided by the total number of game outcomes outstanding--that is, games remaining for the team with the lead plus games remaining for the pursuer. The result is the percentage of favorable game outcomes needed to clinch.
As I pointed out, either form of the magic number leaves out some context. There's a big difference between having a magic number of one on the last day of the season and having a magic number of one with two weeks to play.
The magic percentage addresses that issue, but introduces its own. Two teams just about even in the standings will have M%s around .500, whether it is the first day of the season or the last.
As I said in the last post, if you really want to get serious, you can go the playoff odds route as implemented by Baseball Prospectus and others. Even then, there are a variety of different choices you can make about which factors to consider and how much complexity you are willing to tolerate.
Suppose we just want a crude estimate of playoff probability, and don't want to make any special assumptions about the two teams involved. Instead, we will assume the following:
* Only two teams are relevant in the race (obviously this is blatantly false early in the season, but is often true or close to true in September)
* The total number of outstanding games between the two teams is equally divided between the two (even if there is an odd number of total outstanding games and this is technically impossible)
* The outcomes of the games are independent--both for each team individually and the two collectively (so we're assuming that they're not playing each other)
* The two teams are of equal quality, and this quality is constant from game-to-game (so no home field advantage, and you are always playing against an average team)
After all of these caveats, you may be asking what the point of this exercise is. You are right to be asking that--as I've tried to make clear, I certainly am not asking you to stop considering sensibly constructed playoff probability estimates, or hoping to make you to eschew magic number for magic percentage or magic percentage for a crude probability. However, I personally do think that a crude playoff probability involving very few inputs is worth my time, and so I've shared it here.
What we're going to do is use the binomial distribution to estimate the probability of a team making the playoffs. Let's start with an easy case...there are four total outstanding games remaining, and the Alphas lead the Bravos by one game in the standings. Let's say they are 90-70 and 89-71 respectively. The Alphas have a magic number of two. That means that 2, 3, or 4 favorable game outcomes will result in a victory; 1 favorable outcome will result in a one game playoff; and zero favorable outcomes will give the Bravos the title.
What is the probability of a favorable outcome? Well, I've declared that the two teams are of equal quality, so it's close to 50%. Even if the two teams were true talent .900 teams, that would mean there is a 90% chance of a favorable outcome (for the Alphas) in an Alpha game and a 10% chance of a favorable outcome (for the Alphas) in a Bravo game.
Of course, this is a cheat--the weighted average of the individual probabilities does not capture the real dynamics of the situation, unless both teams are exactly .500. But for real teams, the discrepancies are not going to be as large, particularly over small numbers of games outstanding. If for instance you needed a .600 team to win and a .600 team to lose, the actual probability of that is .6*.4 = 24%; assuming that the probability is a uniform .5 results in an estimate of 25%. The differences could be greater over a longer period of games (*), so instead of saying that the probability of a favorable outcome is 50% as long as the two teams are of equal quality, it's safer to say that CPP assumes that all teams are of .500 true quality.
So, we can use the binomial distribution to figure the probability of X favorable game outcomes--there's a .5^4 = 6.25% that four outcomes go the Alphas' way, a (4 3)*.5^.3*.5 = 25% chance that three outcomes go their way, and a (4 2)*.5^2*.5^2 = 37.5% chance that two outcomes go their way, meaning the Alphas will win outright 68.75% of the time. There will be a one-game playoff (4 1)*.5*.5^3 = 25% of the time, which we expect them to win half of the time (12.5%), so the total probability of the Alphas winning the race is 81.25%.
To write this all up as a formula, let's christen this CPP for Crude Playoff Probability:
CPP = sum(n = M# to GO) [(n GO)*.5^n*.5^(GO - n)] + (M#-1 GO)*.5^(M# - 1)*.5^*(GO - (M# - 1))
If you want to plug this into Excel and take advantage of the cumulative binomial function, the formula is:
CPP = 1 - binomdist(M# - 1, GO, .5, true) + binomdist(M# - 1, GO, .5, false)/2
Where M# is the magic number and GO is the total games outstanding.
To rehash, CPP is the probability of winning a pennant race against another team assuming that:
1. teams are of constant quality from game-to-game, regardless of opponent or home field advantage
2. both teams are .500
3. game results are independent
4. there are no head-to-head games remaining between the two teams
That is a lot of qualifiers, which is why it is admittedly a crude probability.
Let's look at how CPP compares to M% for a team with a M# of two depending on how many game outcomes are outstanding:

Of course CPP approaches one much more quickly than the M% approaches zero, which is fine--the M% does not consider the exponential effect that slashes the probability of winning when you are coming from behind.
I also figured CPP for the MLB standings after games of September 24, 2009 (the day before I wrote this post). Here they are:

I really did this too late in the '09 season to be of any interest, as this year did not feature many close races and most of these were on the verge of being wrapped up. Still, it might be of interest to compare them to BP's estimate of the probabilities at the same moment. I looked at their normal postseason odds report; even though I definitely prefer the PECOTA-adjusted version, that one considers not just displayed team quality but the expected future performance of the players. The more layers of complexity that are added on, the less we expect the results to resemble those of CPP. Also keep in mind that CPP pretends as if there are only two teams involved in each race.
CPP gave the Red Sox a .6% chance to pass New York and the Twins a 9.5% chance to pass Detroit, while BP estimated 1.1% and 16% respectively. A large part of the difference is that the Red Sox and Yankees still had three games to play head-to-head and the Twins and Tigers had four. CPP gives the Rangers a .1% chance; BP said .2%.
In the NL, the two approaches agreed that the Braves had a .1% chance to win the division; BP held out .1% for the Cubs while CPP rounded it down to zero; and they agreed that the Rockies had a .2% chance to win the West. The wildcard race was the biggest difference; CPP had Colorado at 94.2% while BP gave them a 86.3% total playoff probability. The schedule had something to do with it, undoubtedly--seven of Colorado's's last ten games were against the Braves--as did the fact that San Francisco and Florida were still hanging around. However, CPP was much significantly less sanguine about Atlanta's hopes (5.8%) than was BP (9.9% to make the playoffs).
All in all, though, the correlation is pretty strong. The strength of CPP (simplicity) is also its weakness--it doesn't consider schedule, team quality, identity of personnel, home field advantage, etc. But the plus is that you save a lot of work and can fit the formula in Excel's formula bar. You would certainly want to be wary of CPP early in the season, as multiple teams are always in the hunt, but if at some point there is a clearly defined two-team race, it won't lead you too far astray, provided there aren't a very large percentage of head-to-head matchups remaining.
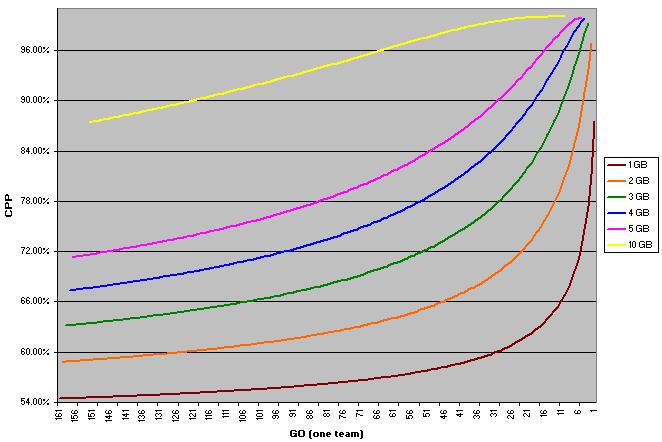
If we assume that both teams have played an equal number of games, then we can calculate M# as GO(one team) - GB + 1. Using this formula, here is a chart showing the CPP for a 1, 2, 3, 4, 5, and 10 game lead at each possible one-team GO value where a lead of that size to a) exist and b) have both teams still alive. So the line for a one game lead starts at 161 (games have to be played before a team can have a one game lead) and ends with 1 GO. The line for five games behind doesn't start until five games have been played (again, the earliest point at which a team can lead by five) and ends at five one-team GO (because any deeper into the season with a five game lead than that means the team has clinched):
In tribute to Bobby Thomson, here is a CPP chart for the Dodgers and Giants in 1951; remember that the probabilities relate only to the two rivals, not considering the other six NL clubs. I did not include the playoff series on the chart, because it would have produced a couple of wild swings which would detract from the picture of the race itself (New York won the first game and thus had a 75% probability, then Brooklyn won game two to bring it back down to 50%). The low point for Giant hopes was .3% on August 11, which is also the point of their largest deficit (13 games with 92 games outstanding).
The date that marked New York's true rise from the dead was September 25. Coming in, they trailed by two and a half with just eleven games outstanding, for a 7.3% CPP. The Giants beat the Phillies while the Braves swept the Dodgers in a doubleheader, leaving New York one back with eight outstanding for a 25.4% CPP. It was the first time their CPP had been in double digits since July 17, when they trailed Brooklyn by 7.5 with 137 outstanding (10.1% CPP), and the last time New York had been at a higher probability was July 3, when they were four back with 164 to play (26.7%).
Both teams won on the 26th, dropping Giants to 22.7%; on the 27th New York was idle while Brooklyn lost to Boston, leaving a half game margin with five outstanding (34.4%). Brooklyn lost to Philadelphia on the 28th to leave the teams in a tie with four outstanding, and both teams won their final two games to force the playoff, so the probabilities stayed at 50%.
Not including their 1-0 playoff lead, New York's highest CPP for the season was after Opening Day, when they established a one game lead on Brooklyn (54.5%). They dug an April hole (3-12, 23.7%), then won thirteen of eighteen to pull to within two games on May 19 (40%). June 2 (3.5 back with 223 games outstanding) marked their last time over 30% until late September (32%).

After the games of Sunday September 5, the CPPs for the race leaders against their respective second-place teams are:
NYA/TB: 75.6%
MIN/CHA: 83.4%
TEX/OAK: 99.3%
TB/CHA: 97.3%
ATL/PHI: 61.0%
CIN/STL: 97.1%
SD/SF: 60.8%
PHI/SF: 71.2%
I'll update this again in a week along with a rehashing of the easy gages of a team's position in the race.
(*) Suppose that over a period of 20 games (ten games each for two teams, no head-to-head games), we are interested in one of the team getting 15 favorable outcomes. CPP assumes that each game is a toss-up, and so the probability of 15/20 is just:
(20 15)*.5^15*.5^5 = 1.479%
Let's assume instead that the two teams are of equal true quality x. How many different ways can these 20 games combine for 15 favorable outcomes? We could have (10 wins, 5 losses), (9 wins, 6 losses), (8, 7), (7, 8), (6, 9), and (5, 10). The probability of (10, 5) can be broken down:
P(10 wins for Team A) = x^10
P(5 losses for Team B) = (10 5)*x^5*(1-x)^5
P(10, 5) = [x^10]*[(10 5)*x^5*(1-x)^5]
Repeating this calculation for all of the possible combinations that produce 15 favorable outcomes, here are the probabilities for several different values of x:

Assuming that both teams are .500 is in the ballpark for better teams, but far from a precise approximation. The accuracy of the approximation starts plummeting as one moves further away from .500, but that moves outside the range of true quality for major league teams. Even if there was such a team, it wouldn't be involved in a pennant race.
Perhaps I should have called it Generic Playoff Probability, because that's really what it is. Assume that it's a two-team race, and then pretend that all you know is the team's magic number and how many games are left to play.
Monday, September 06, 2010
(Very) Crude Playoff Probabilities
Subscribe to:
Post Comments (Atom)
No comments:
Post a Comment
I reserve the right to reject any comment for any reason.