I devoted a whole post to leadoff hitters, whether justified or not, so it's only fair to have a post about hitting by batting order position in general. I certainly consider this piece to be more trivia than sabermetrics, since there’s no analytic content.
The data in this post was taken from Baseball-Reference. The figures are park-adjusted. RC is ERP, including SB and CS, as used in my end of season stat posts. The weights used are constant across lineup positions; there was no attempt to apply specific weights to each position, although they are out there and would certainly make this a little bit more interesting:

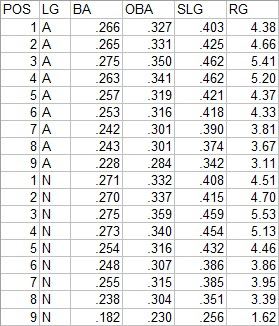
For the seventh consecutive season, NL #3 hitters are the best position in baseball. It is interesting to note that the NL is superior at the majority of the lineup spots (1, 2, 3, 5, 7), yet the AL holds a slight advantage in RG from spots 1-8 combined (4.49 to 4.45). #2 hitters outperformed #5 hitters in both leagues, although the #5 spots remain home to a higher ISO than #2. Last year AL #6 hitters were quite poor (better than only three other spots); that was just a blip and the AL #6 hitters were easily the best of the eight 6-9 spots in 2015.
Next are the team leaders and trailers in RG at each lineup position. The player listed is the one who appeared in the most games in that spot (which can be misleading, especially for spots low in the batting order where many players cycle through):


The Cubs #8 and #9 spots mess up both the leaders and trailers list for the NL as the former trail thanks to Joe Maddon’s singular devotion to batting the pitcher eighth, which he did for almost every game the Cubs played in a NL park. Last year I noted in this spot that you could see why Seattle wanted Nelson Cruz as they had the AL’s worst cleanup production; Cruz turned that completely around in 2015. As I write this, a Brandon Phillips trade to Washington appears to be in the works and the MLBN commentators are seriously discussing the possibility that Dusty could lead him off. And how sad to see lineup spots led by Joe Mauer, Albert Pujols, and Ryan Howard on the trailers list (ok, the first two are sad, the latter is hilarious).
The next list is the ten best positions in terms of runs above average relative to average for their particular league spot (so AL leadoff spots are compared to the AL average leadoff performance, etc.):

And the ten worst:

I’ve run this report since 2009; -53 is surpassed only by last year’s TEX #3 hitters (for the record, they were +6 in 2015). Again, though, this is essentially comparing a full-time pitcher spot in the order to NL #8 hitters, which include only a smattering of pitchers, so it’s a misleading number (except to the extent that Joe Maddon did punt on his #8 lineup spot).
The last set of charts show each team’s RG rank within their league at each lineup spot. The top three are bolded and the bottom three displayed in red to provide quick visual identification of excellent and poor production:


The full spreadsheet is available here.
Monday, January 04, 2016
Hitting by Lineup Position, 2015
Subscribe to:
Post Comments (Atom)
No comments:
Post a Comment
I reserve the right to reject any comment for any reason.