The American Association entered its second season having gotten the attention of the National League if nothing else. Some AA clubs began to sign some NL players away, and as the AA did not have a reserve clause itself, players jumped between association clubs. Some blacklisted NL players (most notably Charley Jones) were signed to AA contracts.
On February 17, NL president Abraham Mills and AA representative O.P. Caylor met in New York and agreed upon a truce of sorts. Each league agreed to a reserve limit of eleven players per team, to honor contracts and blacklists of the other circuit, and to allow exhibitions between NL and AA clubs.
The AA followed the NL’s lead (or perhaps it was the other way) in expanding the schedule to 98 games and in forming an eight team circuit. The New York Metropolitans, a strong independent club that had been flirting with the two majors for a couple of years joined, as did Columbus’ first major league team.
The AA even followed the NL’s lead in having a two city Memorial Day doubleheader, as the Reds lost 1-0 to the Mets, then beat the Athletics 10-8 in eleven innings. Other noteworthy happenings were Columbus’ 25-10 thrashing of the Alleghenys on June 13 in which they scored in every inning; Cincinnati’s 23-0 rout of Baltimore on July 6; and Cincinnati’s John Reilly hitting for the cycle on September 12 in a 27-5 win over the Alleghenys, then cycling again one week later.
The AA had its first great pennant race, as defending champ Cincinnati, second place Philadelphia, and upstart St. Louis went at it. On September 6, the Athletics completed a three game sweep of the Browns that maintained their lead. With one week to go, they led by 2.5, but promptly lost a pair to Louisville as St. Louis took care of the Alleghenys. On September 28, they were finally able to clinch when they defeated the Eclipse 7-6 in ten innings on Guy Hecker’s wild pitch. The final margin was just one game over St. Louis, with Cincinnati five back.
After the season, the two pennant winners (Boston and Philadelphia) were going to face each other, but the Athletics dropped two of three to their hapless NL citymates and decided the better of it. While the leagues would not meet on the field, they did meet in a negotiating room. The National League and the minor Northwestern League were set to formalize a pact governing their relationship when NL president Mills reluctantly suggested bringing the AA to the table as well, as the agreement would not be particularly valuable if the other major league was not party to it.
The AA did come to the table, and on October 27, the three circuits agreed to what was called the Tripartite Agreement. It formalized the relationships between the leagues and defined the club’s territorial rights. With this agreement, the concept of Organized Baseball as an entity larger than even the major leagues themselves was established for the first time. The Tripartite Agreement would later be expanded to include other leagues and become known as the National Agreement.
Just as the NL and the AA had come to terms, a new challenge was on the horizon, and the strength of their tenuous peace would be put to the test, as would the strength of the circuits themselves.
STANDINGS

The Reds topped the league in EW% and their margin "should" have been around eight games, but instead they finished five back. Meanwhile, Philadelphia and St. Louis were even closer in EW% than they were on the field, and they were only one game apart on the field. New York was a first division team right off the bat, and Columbus was respectable. Baltimore was at least within hailing distance of another club, but that was more due to serious Allegheny decline than any Oriole leap forward.
In 1883, the AA hit .252/.282/.331 for a .121 SEC, 5.72 runs and 24.01 outs per game.
PHILADELPHIA

The Athletics copped the city’s second pennant, as the Athletics (different club) had captured the inaugural National Association title in 1871. The team loaded up with talent from the NL: Stovey and Corey from defunct Worcester, Bradley from Cleveland, Mathews from Boston, and Knight from Detroit.
The team had an interesting third base/pitcher platoon, as George Bradley and Fred Corey played 44 and 39 games there respectively and were second and third on the team in innings. Ace Bobby Mathews was a weak hitter (44 ARG) and generally either pitched or rode the bench.
Shortstop Mike Moynahan posted the team’s highest WAR. According to Jim Charlton’s chronology, on May 27, 1882, Moynahan broke his finger against the Metropolitans and had it amputated at the first joint. At the time, Moynahan was playing for the Philadelphias, the Al Reach-backed independent club that had been passed over for AA membership in favor of the Athletics (thanks to Richard Hershberger for confirming that Moynahan played for the Philadelphias in 1882).
Rookie Jack Jones (5-2 in 65 innings, 6-5 in 92 innings for Detroit earlier in the season) won the pennant-clinching game for the Athletics. He left the game after the season to pursue dental school.
According to the The Ball Clubs, a Philadelphia zookeeper thought up the idea of having carrier pigeons relay the score to other points in the city at the conclusion of each inning, and implemented this scheme at least on a limited basis.
ST. LOUIS

The Browns turned over more than half of their regulars in climbing from fifth to second. The new catching platoon of rookie Tom Dolan and Pat Deasley each came over from the NL (BUF and BSN respectively). George Streif came from the Alleghenys, rookie Arlie Latham had played with Buffalo in 1880, Tom Mansell had played for Troy in 1879 and then for Detroit in the beginning of 1883, Fred Lewis had played for Boston in 1881, Hugh Nicol came from Chicago, and Tony Mullane was whisked away from Louisville.
Ted Sullivan started as manager, but was replaced by Charlie Comiskey despite boasting a 53-26 record. The second-year first baseman also turned in a much improved season at the plate.
When Mansell was with Detroit this season, he posted an ARG of just 77 in 139 PA. With the Browns, he batted .402 in 119 PA.
CINCINNATI

The Reds did not change their personnel much from their pennant winning 1882 campaign. John Reilly, who had last played in a major league with the old Reds in 1880, took over at first base and emerged as the team’s top hitter. Charley Jones, last with the Boston Reds in 1880 due to being blacklisted, was 33 but vied with Reilly for the team lead in WAR. Rookie Pop Corkhill was the right fielder, and rookie Ren Deagle pitched well.
The Reds apparently believed that they had an agreement with hometown catcher Buck Ewing, then with Troy. If they actually did, Ewing reneged, signing instead with the NL’s New York entry.
NEW YORK

The Mets were controlled by John Day and Jim Mutrie, who also backed the NL’s Gothams. Day was a tobacconist and his independent club had been founded in 1880 and developed into a strong outfit (according to Cliff Blau, they were 101-58-3 overall in 1882 and 5-1 against AA opponents). Mutrie managed the Mets, but that didn't distill the appearance that they were playing second fiddle. Both teams played at the Polo Grounds, but a canvas fence separated their fields, and the Gothams drew ritzier crowds (the twenty-five cent admission price gap between the two circuits was of course a factor in that). The AA demanded on threat of expulsion that the team have its own park for 1884.
The last big league stops of the players were: Holbert (TRO), Crane (BUF, 1880), Esterbrook (CLE), Nelson (WOR, 1881), O’Rourke (BSN, 1880), Roseman (TRO), Keefe (TRO), and Lynch (BUF, 1881). Lynch, Brady, Nelson, and Kennedy were holdovers from the 1882 roster.
Bill James claims that Keefe had developed “what has been described as” the first modern changeup and began using it this season. Sam Crane was arrested for running off with Hattie Tavenfelter, the wife of a Scranton fruit dealer, and $1,500 of his savings.
The Mets let heavyweight champ John Sullivan pitch in two exhibition games; he later lost his title to John Corbett in 1892. The Reach Guide (quoted in Bill James’ New Historical Baseball Abstract) wrote: “a number of ball-players lost heavily on the Corbett-Sullivan prize fight. It was a notable fact that five out of every six ball-players were ardent believers in Sullivan’s superior powers.”
John O’Rourke was playing in his final big league season (he played for Boston in 1879 and 1880) despite hitting very well yet again. I could not find any secondary sources that discussed him in detail, so I asked for leads on SABR-L. The information that follows is based on Frank Vaccaro's research, which he shared on the list.
O'Rourke's pro career started in 1877 with the Mansfields of the International Association. In 1878 he hit .376, leading the IA, and signed with Boston after the season. In 1881 he reemerged with the Philadelphia Athletics of the Eastern Championship Association (who would become an inaugural AA member the following season). After playing for the Mets in 1883, he never appeared in the majors again. Vaccaro cites an April 6, 1884 report in the Cincinnati Enquirer that O'Rourke was working as a baggage master for an eastern railroad and was not playing ball because he demanded to be paid the value of "a small city, with town hall and other public buildings".
O'Rourke was apparently considered something of an oaf in comparison to his famous older brother, but it seems as if his real job was the reason that his major league career ended after 1883, not any on-field deficiency.
LOUISVILLE

The Eclipse improved their winning percentage, but dropped out of the first division and slipped two spots in the standings in the expanded eight team association; the defection of ace Tony Mullane to St. Louis was certainly a major factor. He was replaced by the Athletics’ Sam Weaver. The infield was redone, with Joe Gerhardt (last with Detroit, 1881), Jack Gleason (St. Louis), Jack Leary (Alleghenys), and rookie Tom McLaughlin playing significant roles. Catcher Ed Whiting was brought in from the Orioles.
Chris Von der Ahe, owner of the Browns, apparently offered each of the Louisville players a new suit if they could sweep the Athletics late in the season. They won the first two, but Guy Hecker’s wild pitch cost the Browns the pennant and the Eclipse some new threads.
COLUMBUS

The Colts were my favorite city’s first major league outfit. They were managed by Horace Phillips, the former Athletics manager who had sought to organize the AA before being fired by his players. The team featured four rookies: Field, Kuehne, Valentine, and pitcher Ed Dundon, the majors’ first deaf player.
The rest of the regulars had all played in 1882: Kemmler (PIT), Smith (LOU), Richmond (CLE), Wheeler (CIN), Mann (PHA), Brown (BAL), and Mountain (WOR).
PITTSBURGH

Despite playing 21 more games, the Alleghenys came up eight wins short of their 1882 output. Their field also partially flooded in June, which helped facilitate Columbus’ rout described earlier; the soggy conditions hampered outfielders.
John Peters fell off the cliff at age 33, batting just 28 times. He would have an even shorter stint with the team in 1884 and depart the scene for good. Peters was replaced at short by Louisville’s Denny Mack, pretty much a replacement-level player. Jackie Hayes (Worcester) took over primary catching duties as Billy Taylor moved to right, filling the position vacated by Ed Swartwood, who moved to first. George Creamer, also last with Worcester, took over at second; Buttercup Dickerson, last with the same late NL franchise in 1881, played center. Two rookie pitchers, Bob Barr (not the presidential candidate) and Jack Neagle, who also spent time with the Phillies and the Orioles in 1883, filled the innings left available by Harry Salisbury’s departure (Salisbury never pitched in the majors again despite being just 28 and having been above average in 1882).
While they weren’t good, this outfit was certainly interesting. David Nemec describes them as “boozing, brawling, bad-ass”. Billy Taylor, Mike Mansell, and George Creamer were suspended August 20 for drunkenness after a game with Louisville. In November, Taylor married a female baseball player despite apparently being warned that the relationship was not destined for the fairy tales. Shortly thereafter, he was arrested after allegedly robbing her ex-boyfriend.
BALTIMORE

The Orioles, as best as I can tell, were the first team ever to turn over their entire group of regulars in a single season. Cliff Blau has unearthed that this was a different organization than the Baltimore AA club of 1882, and the player turnover is an indication of that.
It didn’t really help much (although some of it was probably not by choice), as they improved from .260 to .292. As with the NL Phillies, Baltimore used an abnormally large number of players (29). The AA average was 18 and the Browns were next with 21.
The team's regulars with big league experience were: Kelly (CLE), Stearns (CIN), O’Brien (WOR), Manning (PRO), Say (LOU), Clinton (WOR), Eggler (BUF, 1879, and he returned to the Bisons mid-season), Rowe (CLE), Fox (BSN, 1879).
Leaders and trailers:
BATTING AVERAGE
1. Ed Swartwood, PIT (.357)
2. Pete Browning, LOU (.338)
3. Jim Clinton, BAL (.313)
Trailer: Hardie Henderson, BAL (.162)
Trailing non-pitcher: Dave Eggler, BAL (.188)
ON BASE AVERAGE
1. Ed Swartwood, PIT (.394)
2. Pete Browning, LOU (.378)
3. Mike Moynahan, PHA (.360)
Trailer: Dave Eggler, BAL (.192)
SLUGGING AVERAGE
1. Harry Stovey, PHA (.506)
2. John Reilly, CIN (.485)
3. Ed Swartwood, PIT (.476)
Trailer: Dave Eggler, BAL (.198)
SECONDARY AVERAGE
1. Harry Stovey, PHA (.266)
2. Charley Jones, CIN (.228)
3. Pop Smith, COL (.202)
Trailer: Dave Eggler, BAL (.015)
RUNS CREATED
1. Ed Swartwood, PIT (98)
2. Harry Stovey, PHA (96)
3. John Reilly, CIN (91)
4. Mike Moynahan, PHA (85)
5. Candy Nelson, NYA (83)
ARG
1. Candy Nelson, NYA (169)
2. Pete Browning, LOU (166)
3. Ed Swartwood, PIT (160)
4. John Reilly, CIN (151)
5. Charley Jones, CIN (149)
Trailer: Dave Eggler, BAL (40)
WAA
1. Candy Nelson, NYA (+3.6)
2. Ed Swartwood, PIT (+2.9)
3. Pete Browning, LOU (+2.9)
4. John Reilly, CIN (+2.8)
5. Charley Jones, CIN (+2.5)
Trailer: Joe Battin, PIT (-2.0)
WAR
1. Candy Nelson, NYA (+5.7)
2. Bill Gleason, STL (+4.4)
3. Pete Browning, LOU (+4.2)
4. Charley Jones, CIN (+4.0)
5. John Reilly, CIN (+4.0)
Trailer: Dave Eggler, BAL (-.9)
ARA
1. Will White, CIN (73)
2. Tim Keefe, NYA (76)
3. Bobby Mathews, PHA (82)
4. Jumbo McGinnis, STL (84)
5. George Bradley, PHA (84)
Trailer: Jack Neagle, PIT (151)
WAA
1. Will White, CIN (+5.0)
2. Tim Keefe, NYA (+4.6)
3. Bobby Mathews, PHA (+2.2)
4. Jumbo McGinnis, STL (+2.0)
5. Tony Mullane, STL (+1.6)
Trailer: Hardie Henderson, BAL (-2.9)
T WAR
1. Tim Keefe, NYA (+6.7)
2. Will White, CIN (+6.3)
3. Tony Mullane, STL (+3.7)
4. Guy Hecker, LOU (+2.4)
5. Jumbo McGinnis, STL (+2.3)
Trailer: Hardie Henderson, BAL (-2.9)
My all-star team:
C: Jack O’Brien, PHA
1B: John Reilly, CIN/Ed Swartwood, PIT
2B: Joe Gerhardt, LOU/Bid McPhee, CIN
3B: Hick Carpenter, CIN
SS: Candy Nelson, NYA
LF: Pete Browning, LOU
CF: Charley Jones, CIN
RF: Hugh Nicol, STL
P: Tim Keefe, NYA
P: Will White, CIN
P: Tony Mullane, STL
MVP: SS Candy Nelson, NYA
Rookie Hitter: 3B Arlie Latham, STL
Rookie Pitcher: Ren Deagle, CIN
There’s not enough to decide at first base; I have Reilly at +2.79 wins versus an average hitter, +3.95 versus a replacement level hitter. Swartwood is at +2.88 and +3.91, and each has -1 Fielding Runs by Pete Palmer’s method. That is simply too close to call, and the two decimal places are the very definition of false precision.
I also decided not to decide at second base. Gerhardt is .2 WAR behind McPhee as I figure it, but Palmer has him at +18 fielding while McPhee is only +4. However, the eighteen runs is out of line with most of Gerhardt’s career, and McPhee also has an excellent defensive reputation. You decide which figures you trust and to what extent.
Candy Nelson’s season is worth taking a longer look at. Nelson had begun his career at age 23 with Troy and the Eckfords of Brooklyn in the National Association. For 1873-75, he played for the Mutuals, then did not reappear in a major league until 1878 with Indianapolis, 1879 with Troy, and 1881 with Worcester. In 1882 he played for the Mets in their last season as an independent club. His best season in terms of Palmer’s Batting Runs was +4 in 1879, and he was never a regular in the NL, although he had been with the Mutuals.
The rest of this is a digression into the whys and wherefores of sabermetric methodology, and anyone who is primarily interested in the history part of this can feel free to stop reading. Palmer’s system is not crazy about his 1883 season; he comes in at +14 runs offensively, -7 in the field, for a TPR of .9. TPR picks John Richmond of Columbus as the AA’s top player on the strength of 27 Fielding Runs. Leaving that aside, the top batter in the Association is Swartwood at +41 runs.
By my way of figuring these things, Nelson is +34 runs offensively and Swartwood is +37. As you can see, we essentially agree about Swartwood, but diverge by twenty runs on the question of Nelson’s contributions. What could possibly cause such a large difference?
The answer is park factor. Palmer figures park factors for the nineteenth century; I do not. I have gone with the approach that Bill James used in his (original) Historical Baseball Abstract--use the runs scored and allowed in the player’s team’s games as the context in which to evaluate him. There is an argument to be made that this is ideal, but in this case, the pragmatic argument was all it took to convince me to use this approach. Ballparks in the nineteenth century were transient by today’s standards--they were always burning down, being rebuilt, etc. Even if there is a team with a stable park, the rest of the league is changing around it--not just the parks of the other teams, the identities of the teams themselves.
Park factors require some minimum degree of continuity to work properly. I do not believe that the nineteenth century meets the standard. Thus, if I wanted to figure PFs, I would have to do it on a single year basis. Then you have to deal with the fact that the sample data is being drawn from a 100 game season rather than a 162 game season. You would have to regress the PFs very heavily. In the end, I think it is a fool’s errand.
In some cases, it may cause distortions. Nelson’s Metropolitans allowed only 405 runs, best in the association--but they also scored just 498 runs, fifth in the association. Some of this may have been due to the park in which they played, but some of it may have just been great pitching (certainly Keefe was in fact a great pitcher) coupled with an average offense. So perhaps Nelson and his offensive teammates are getting an unfair break, being evaluated against an average expected contribution that is too low.
In fact, Palmer’s park factor for the 1883 Mets is 104, meaning a park that inflated seasonal totals by 4%. It is true that New York and their opponents averaged 9.72 runs in the 47 games played at New York and 8.92 runs in the 50 road games. So in this case, it may have been a lousy offense coupled with a great pitcher producing a low number of runs per game.
If I figure Nelson’s runs above average with a park factor of 1.04 coupled with the association average of 5.72 runs/game, he is +20, and thus Pete and I only disagree by six runs.
Wednesday, March 09, 2016
1883 AA
Monday, February 15, 2016
Running With the Devil (You Know)
Greg Beals enters his sixth season at the helm of an OSU baseball program going that, by multiple common sense measures, is suffering through a rough period that corresponds closely to his tenure as coach. OSU’s six-year NCAA Tournament drought is the program’s longest since 1983-1990. OSU’s five-year record of 159-125 (.560) is the program’s worst since 1986-1990 (.500), except for the overlapping period of 2010-2014 (.543). In addition to the bottom line of wins and losses, Beals teams have displayed a propensity for late-season collapses and a recurring theme of horrific baserunning that I used to try to document but now have lost the strength (and frequent trips to Bill Davis Stadium to see the Bucks play in person). Suffice it to say some must be seen to be believed, and the hashtag #BealsBall will give you a taste of what is being taught in Columbus.
Despite his mediocre record, Beals received a two-year contract extension through 2017 after the season as reported by B1G Baseball. Ordinarily, I would hope that this was a “program continuity” contract, granted with the knowledge that having a lame duck collegiate coach can be a major obstacle in recruiting. However, given that Beals already skippered 2015 without a contract, two years in writing has more of the feel of an actual extension.
Regardless of my own reservations about the man in charge, the players on the field deserve the bulk of the attention. But while OSU returns a large senior class, on paper this team does not strike me as an obvious Big Ten championship contender or NCAA Tournament team.
One spot where virtually no experience returns is catcher. Co-starters Aaron Gretz and Conor Sabanosh both graduated, leaving junior captain Jalen Washington as the backstop. Washington’s limited playing time over the past two seasons has been mostly as a pinch-runner or defensive replacement at second base. Thirty-three plate appearances are insufficient to make any conclusions regarding his offense, but they have been middling BA, no secondary average PA. Washington will be backed up by freshman Jacob Barnwell and sophomore Jordan McDonough. The latter is more likely to get in the lineup as a DH than as a catcher, however. Freshman Andrew Fishel rounds out the corps.
First base will be up for grabs between a pair of seniors, Zach Ratcliff and Ryan Leffel. Ratcliff has always teased with power potential that the lineup could desperately use, but has never been able to find his way into the lineup on a consistent basis (career .263/.304/.403 line in 199 PA). Leffel can play third base and has always found his way into the lineup. His junior season was rough (.211/.333/.267 in 107 PA), but his sophomore season was of Beals’ dreams (.303/.369/.343 in 110 PA). I will personally be surprised if Leffel does not get the lion’s share of time at first.
The rest of the infield positions will be in the hands of multi-year senior starters. Second base will belong to Nick Sergakis, who in his two-year OSU career has hit .281/.358/.364 in 357 PA with questionable fielding. At third, Troy Kuhn is a .275/.362/.469 career hitter in 543 PA. Shortstop Craig Nennig is a slick fielder, but for some reason rarely gets pinch-hit for despite a .235/.314/.280 line in 401 PA. In the case of injuries to any of the three, expect Sergakis to slide into the open spot and senior L Grant Davis to play at second. Davis was surprisingly good offensively last year (.282/.347/.353 in 95 PA) and should make a fine utility infielder. Other infield reserves include true freshmen Brady Cherry at third, Casey Demko in the middle, and Matt Carpenter.
The team’s only legitimate power threat is junior left fielder (and erstwhile center fielder) Ronnie Dawson (.307/.379/.460 with 11 homers in 469 career PA). Dawson is prone to some baserunning blunders and outfield adventures, but still is by far the most exciting player on the roster. Junior center fielder Troy Montgomery is the leadoff hitter and had a fantastic sophomore season (.317/.431/.493 with 35 steals in 41 attempts). Right field must replace Pat Porter, drafted by the White Sox, and a platoon of junior Jacob Bosiokovic and senior Daulton Mosbarger is expected (for positions in which newcomers will play, I relied on the season preview released by the athletic department for guidance on what to expect). Bosiokovic had a promising freshmen season in 2013 as a third baseman, held his ground as a sophomore, but got a medical redshirt last year after appearing in just five games. He will also be an option at first base and with a career line of .264/.341/.360 in 421 PA, a return to health would be a boost to the Buckeye offense. Mosbarger is a senior transfer from Akron, where he was a career .247/.366/.359 hitter in 465 PA. He may be an interesting case study in whether great patience can survive Beals’ preference for a contact-oriented approach.
The key reserve outfielders are speedy sophomore Tre’ Gantt (a promising .311/.373/351 in 82 PA in 2015) and senior Jake Brobst (who has served mostly as a pinch-runner in his OSU career). Redshirt freshman Ridge Winand and true freshman Jacob Vander Wal (yes, he is the son of John) are also on the roster. DH starts could go to McDonough, Leffel/Ratcliff, Bosiokovic/Mosbarger, Gantt, or even Davis, but I think Beals will have a hard time keeping Gantt out of the lineup, even if he may not be a prototypical DH.
OSU should be able to muster a decent offense, led by Dawson and Montgomery with solid contributors in Kuhn, Sergakis, and the right field/DH units. But catcher, first base, and shortstop will likely hold the offense back from scoring runs at a championship level. And a strong lineup may be needed because questions abound on the pitching staff.
OSU lost its two best pitchers, Ryan Riga to graduation and Travis Lakins to the Red Sox, leaving junior lefty Tanner Tully, a soft-tosser who rode a 5.1/.7 K/W to a great freshman season (3.20 eRA) but was hit hard last year (5.3/1.8 with a 5.75 eRA and .345 BABIP) as the #1 starter. While it is safe to assume that Tully’s true level is somewhere in the middle, it does not appear to be the profile of a #1 starter for a conference champion. Sophomore righty Adam Niemeyer is penciled in at #2. He worked 33 innings over 12 appearances (4 starts) as a redshirt freshman, with 5.7/1.9 K/W and a 3.79 eRA. The #3 spot (and thus the one or two mid-week starter positions) is up for grabs, with next to no returning experience in the mix. Senior lefty John Havird was solid in 27 innings (mostly in relief) last year, with 9.8/3.6 K/W and a 4.17 eRA. Sophomore right Austin Woodby transferred from Cincinnati, where he had an uninspiring freshman season in 2014 (20 K/7 W in 33 IP with a 5.18 ERA). Redshirt sophomore right Yianni Pavlopoulos threw nine innings of relief for the Bucks in 2014, and the other contender is true freshman righty Ryan Feltner. Starting pitching is a definite area of concern.
The bullpen lost closer Trace Dempsey, and while senior Jake Post is listed on the roster, his injury at the end of 2015 plus his omission from OSU’s season preview suggests a medical redshirt is in the cards. Without Post, OSU’s bullpen is also a near-complete rebuild job from 2015. The three key right-handers are junior Shea Murray, who throws hard but has yet to harness his control (career 13 K/10 W in just 10 IP); sophomore Seth Kinker, a three-quarter slinger who had a promising freshman campaign (19 K/3 W, 2.84 eRA in 22 IP); and sophomore Kyle Michalik, who was passed by Kinker on Beals’ pecking order as 2015 progressed despite also pitching effectively (12 K/5 W, 2.92 eRA in 19 IP).
Beals is a strong believe in left-right matchups out of the pen, which means he will rely on some combination of senior Michael Horejsei (career 5.67 ERA despite 23 K/7 W in 27 IP), redshirt junior Joe Stoll (zero career appearances), and true freshman Connor Curlis to get outs. Other bullpen options include sophomore righty Curtiss Irving off a medical redshirt season and possible two-way performers Bosiokovic (who has never pitched for OSU), Mosbarger (who has pitched for Akron with a bizarre career line of 23 K/27 W but a 1.99 ERA in 31 innings), and Cherry.
The Buckeyes’ schedule appears to be designed to pad the win total early in the season as no strong non-conference foes are on the preseason schedule, and unlike prior years which have mid-conference season matchups against the likes of Georgia Tech, Louisville, and Oregon, OSU will not challenge national powers during the Big Ten campaign. The Buckeyes travel to the old Dodgertown to open the season the weekend of February 19 with games against Toledo (to open and close the weekend), Niagra, and Pitt. The following weekend, OSU competes in Coastal Carolina’s tournament with a pair of games against the hosts plus matchups with Duke and Liberty. The first weekend of March will see OSU in Port Charlotte to play another set of middling northern opponents (Seton Hall, Illinois St., and Boston College). The Buckeyes will then play four games at UNLV to return the Runnin’ Rebels 2015 trip to Columbus before the home opening series, three games with Hofstra the weekend of March 18.
From there, weekend series are mostly Big Ten: Northwestern, out-of-conference against Bethune-Cookman, @ Maryland, Rutgers, @ Illinois, @ Purdue, Iowa, the forces of evil, @ Minnesota. Mid-week opponents include home dates with Xavier, Toledo, Morehead State (two), Cincinnati, UAB (two), Florida Atlantic (two), and Eastern Michigan, along with road trips to Ohio University and Kent State.
The schedule seems to reflect where the program is right now--a middling northern program not eager to take on challenges outside of the Big Ten schedule. While such a strategy is perfectly defensible, even if the program is strong, it is a contrast to the bluster of national contention that peppered the early days of Beals’ tenure. The Buckeyes need only to finish in the top eight of a thirteen-team Big Ten (Wisconsin remains a pathetic, cowardly, contemptible institution) to get to Omaha…for the Big Ten Torunament. That should (better) be attainable, but getting back to Omaha several weeks later seems as far away as it has ever been for what was once (and could be again) a northern baseball power.
Monday, February 01, 2016
Run Distribution and W%, 2015
Every year I state that by the time this post rolls around next year, I hope to have a fully functional Enby distribution to allow the metrics herein to be more flexible (e.g. not based solely on empirical data, able to handle park effects, etc.) And every year during the year I wind up deciding that writing articles about other topics or trying to finish my professional education or watching some terrible TV show like Haven is a bigger priority than explaining how Enby applies.
Enby is a zero-modified negative binomial model to calculate the probability that a team will score X runs in a game. It is without question my favorite of my own body of sabermetric work and yet for some reason the hardest for me to get motivated to write about. Were the problem that I needed to finish working on the model itself, it would be a huge priority (almost a compulsion) for me. But I did that a long time ago, and now just need to make it presentable. I’d say maybe next year but history suggests I’d be lying to you.
Anyway, there are some elements of Enby in this post, as I’ve written enough about the model to feel comfortable using bits and pieces. But I’d like to overhaul the calculation of gOW% and gDW% that are used at the end based on Enby, and I’m not ready to do that just yet given the deficiency of the material I’ve published on Enby.
Self-indulgence, aggrandizement, and deprecation aside, I need to caveat that this post in no way accounts for park effects. But that won’t come in to play as I first look at team record in blowouts and non-blowouts, with a blowout defined as 5+ runs. Obviously some five run games are not truly blowouts, and some are; one could probably use WPA to make a better definition of blowout based on some sort of average win probability, or the win probability at a given moment or moments in the game. I should also note that Baseball-Reference uses this same definition of blowout. I am not sure when they started publishing it; they may well have pre-dated by usage of five runs as the delineator. However, I did not adopt that as my standard because of Baseball-Reference, I adopted it because it made the most sense to me being unaware of any B-R standard.
73.9% of major league games in 2015 were non-blowouts (of course 26.1% were). The leading records in non-blowouts:

The three NL Central powerhouses top the list, with all playing a lot of non-blowout games as you’ll see in a moment (the Cubs had the second-highest percentage of non-blowouts, the Pirates fourth, and Cardinals seventh) and playing very well in those games. Of the three only Pittsburgh had a better record in blowouts, which is unusual as good teams tend to do better in blowouts:

The Blue Jays were an odd case as well, actually sub-.500 (56-57) in non-blowouts but dominant in them. The only other playoff team to be sub-.500 in either was Texas in blowouts (22-25).
This chart is sorted by the difference between blowout and non-blowout W% and includes the percentage of blowouts for each team:

A more interesting way to consider game-level results is to look at how teams perform when scoring or allowing a given number of runs. For the majors as a whole, here are the counts of games in which teams scored X runs:

The “marg” column shows the marginal W% for each additional run scored. In 2015, the fourth run was both the run with the greatest marginal impact on the chance of winning and the level of scoring for which a team was more likely to win than lose.
I use these figures to calculate a measure I call game Offensive W% (or Defensive W% as the case may be), which was suggested by Bill James in an old Abstract. It is a crude way to use each team’s actual runs per game distribution to estimate what their W% should have been by using the overall empirical W% by runs scored for the majors in the particular season.
The theoretical distribution from Enby discussed earlier would be much preferable to the empirical distribution for this exercise, but I’ve defaulted to the 2015 empirical data. Some of the drawbacks of this approach are:
1. The empirical distribution is subject to sample size fluctuations. In 2015, teams that scored 11 runs won 98.5% of the time while teams that scored 10 runs won 98.0% of the time. Does that mean that scoring 12 runs is preferable to scoring 11 runs? Of course not--it's a quirk in the data. Additionally, the marginal values don’t necessary make sense even when W% increases from one runs scored level to another (In figuring the gEW% family of measures below, I lumped games with 11 and 12 runs scored/allowed into one bucket, which smoothes any illogical jumps in the win function, but leaves the inconsistent marginal values unaddressed and fails to make any differentiation between scoring in that range. The values actually used are displayed in the “use” column, and the “invuse” column is the complements of these figures--i.e. those used to credit wins to the defense. I've used 1.0 for 13+ runs, which is a horrible idea theoretically. In 2015, teams were 81-0 when scoring 13 or more runs).
2. Using the empirical distribution forces one to use integer values for runs scored per game. Obviously the number of runs a team scores in a game is restricted to integer values, but not allowing theoretical fractional runs makes it very difficult to apply any sort of park adjustment to the team frequency of runs scored.
3. Related to #2 (really its root cause, although the park issue is important enough from the standpoint of using the results to evaluate teams that I wanted to single it out), when using the empirical data there is always a tradeoff that must be made between increasing the sample size and losing context. One could use multiple years of data to generate a smoother curve of marginal win probabilities, but in doing so one would lose centering at the season’s actual run scoring rate. On the other hand, one could split the data into AL and NL and more closely match context, but you would lose sample size and introduce more quirks into the data.
I keep promising that I will use Enby to replace the empirical approach, but for now I will use Enby for a couple graphs but nothing more.
First, a comparison of the actual distribution of runs per game in the majors to that predicted by the Enby distribution for the 2015 major league average of 4.250 runs per game (Enby distribution parameters are B = 1.0798, r = 3.966, z = .0619):

Enby didn’t predict enough shutouts or two run games, and too many three run games. There’s also a blip in the empirical data at eight runs scored (5.29% compared to 4.55% predicted by Enby). It doesn’t show up on the chart, but Enby predicted .35% of games with 16+ runs scored; the actual frequency was .31%.
I will not go into the full details of how gOW%, gDW%, and gEW% (which combines both into one measure of team quality) are calculated in this post, but full details were provided here and the paragraph below gives a quick explanation. The “use” column here is the coefficient applied to each game to calculate gOW% while the “invuse” is the coefficient used for gDW%. For comparison, I have looked at OW%, DW%, and EW% (Pythagenpat record) for each team; none of these have been adjusted for park to maintain consistency with the g-family of measures which are not park-adjusted.
A team’s gOW% is the sumproduct of their frequency of scoring x runs, where x runs from 0 to 22, and the empirical W% of teams in 2015 when they scored x runs. For example, Atlanta was shutout 17 times; they would not be expected to win any of those games (nor would they, we can be certain). They scored one run 20 times; an average team would have a .082 W% when scoring one run, so they could have been expected to win 1.64 of the twenty games given average defense. They scored two runs 32 times; an average team would have a .283 W% when scoring two, so they could have been expected to win 9.06 of those games given average defense. Sum up the estimated wins for each value of x and divide by the team’s total number of games and you have gOW%.
It is thus an estimate of what W% a team with the given team’s empirical distribution of runs scored and a league average defense would have. It is thus analogous to James’ original construct of OW% except looking at the empirical distribution of runs scored rather than the average runs scored per game. (To avoid any confusion, James in 1986 also proposed constructing an OW% in the manner in which I calculate gOW%).
For most teams, gOW% and OW% are very similar. Teams whose gOW% is higher than OW% distributed their runs more efficiently (at least to the extent that the methodology captures reality); the reverse is true for teams with gOW% lower than OW%. The teams that had differences of +/- 2 wins between the two metrics were (all of these are the g-type less the regular estimate):
Positive: TB, SEA, ATL, PHI, CHA, LA, STL
Negative: NYA, TOR, HOU
Teams with differences of +/- 2 wins between gDW% and standard DW%:
Positive: TEX, ATL, BOS, SEA
Negative: PIT, HOU, SF, STL, MIA
Pittsburgh’s defense allowed 3.679 runs per game, which one would expect to result in a .565 W% with average offense. But based on their runs allowed distribution, one would only expect a .540 W% paired with an average offense. That difference of 4.1 wins was the greatest absolute difference on offense and defense for any major league team, so it may be instructive to look at a graph of their runs allowed distribution and what Enby would predict for such a team (B = 1.0163, r = 3.655, z = .0859):

Pittsburgh had many fewer one-run games than one would expect (actual 8.0%, Enby estimate 14.1%), but allowed two to five runs more than would be expected and allowed eight or more runs 8.0% of the time versus an expectation of 9.4%.
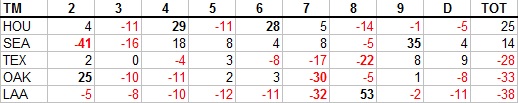
Teams with differences of +/- 2 wins between gEW% and standard EW%:
Positive: SEA, ATL, CHA, PHI, OAK, TB, COL
Negative: HOU, TOR, PIT, NYA, WAS, NYN, SF
It’s no surprise that SEA, ATL, and HOU appear prominently as they were the only teams to have both their offense and defense appear on the positive and negative lists in the same direction. Even with bad clustering of both runs scored and runs allowed, Houston was a good team, but their gEW% of .539 tracks their actual W% of .531 better than their EW% of .576. In 2015, the RMSE of gEW% as a predictor of W% was about 4.4 wins, while EW% had a RMSE of 4.7 wins (gEW% usually, but not always over a thirty team sample, performs better as it should given the advantage of knowing the actual distribution of runs scored and allowed, even treating them independently.)
One might think that the blessed Royals, given their well-known ability to hit at the right time and play the game the right way and so many other attributes that make them so very dear to media members everywhere, would have clustered their runs efficiently. Especially their offense. But they really didn’t. KC’s gOW% was .524; their standard OW% was .524. Their run distribution, converted to equivalent wins with an average defense, was pretty much exactly what you would expect for a team that averaged 4.47 R/G. Their defense was slightly less efficient, with a .529 gDW% and .533 standard DW%. Where Kansas City made hay was the difference between their gEW% (and standard EW%) and their actual W%, which would necessarily result from a more efficient pairing of runs scored and runs allowed. It is quite tempting to credit the bullpen for this, as in theory bullpens can be strategically deployed given the game circumstances and thus increase the covariance between runs scored and allowed. But any such deviation for the Royals falls under the standard deviation from Pythagorean expectation and not anything special in the way the offense or defense alone distributed their runs.
Below is a full chart with the various actual and estimated W%s:

Tuesday, January 19, 2016
Crude Team Ratings, 2015
For the last several years I have published a set of team ratings that I call "Crude Team Ratings". The name was chosen to reflect the nature of the ratings--they have a number of limitations, of which I documented several when I introduced the methodology.
I explain how CTR is figured in the linked post, but in short:
1) Start with a win ratio figure for each team. It could be actual win ratio, or an estimated win ratio.
2) Figure the average win ratio of the team’s opponents.
3) Adjust for strength of schedule, resulting in a new set of ratings.
4) Begin the process again. Repeat until the ratings stabilize.
The resulting rating, CTR, is an adjusted win/loss ratio rescaled so that the majors’ arithmetic average is 100. The ratings can be used to directly estimate W% against a given opponent (without home field advantage for either side); a team with a CTR of 120 should win 60% of games against a team with a CTR of 80 (120/(120 + 80)).
First, CTR based on actual wins and losses. In the table, “aW%” is the winning percentage equivalent implied by the CTR and “SOS” is the measure of strength of schedule--the average CTR of a team’s opponents. The rank columns provide each team’s rank in CTR and SOS:

Two things I always like to touch on is the CTR ranking of the playoff teams and differences in schedule strength. This season the playoffs perfectly selected the ten most deserving teams based solely on win-loss record and schedule. This usually does not happen due to strong or weak teams being bunched in particular divisions or the AL/NL disparity (more on why this was less of a factor in 2015 in a moment). However, the playoff structure was far from free of inequity as the top three teams in the majors all hailed from the NL Central, forcing Pittsburgh and Chicago into a one-game wildcard playoff while the weakest playoff team, the Mets, were rewarded with the NL’s #3 seed.
There is a fun bit of symmetry in this year’s strongest and weakest schedule. The strongest schedule belonged to Detroit. As we will see in a moment, the AL Central had a good year and vied with the East to be the best division in the AL. This year’s interleague divisional matchups were East-East, Central-Central, and West-West, so Detroit also had to face the NL Central juggernauts. Their SOS was 110, meaning their average opponent was about the quality of the Mets (CTR of 109).
The weakest schedule was that of the Mets. The interleague matchups with the AL East team didn’t hurt their strength of schedule, it was simply playing in the weakest division of the six that did. The division champion will typically have the weakest schedule in their division because their four divisional opponents by definition have the weakest possible W% that could be constructed from four teams in said division. So the Mets SOS was 90, which means their average opponent was about equivalent to the Tigers (CTR of 90). It also means that the average Tigers opponent would be expected to win 55% of games against the average Mets opponent.
The division and league composite ratings below are calculated as geometric rather than arithmetic averages:

I believe the NL East’s 77 is the lowest rating for a division during the six seasons I’ve published CTR. 2015 was the first time in that span that a NL division was the best in the majors, but the AL’s implied W% versus the NL has stayed strong (for the three years I’ve been using geometric averages it was .521 in 2013, .544 in 2014, and .531 in 2015).
I will next run through the ratings figured with three alternate inputs quickly with little comment. The first is based on game-Expected W%, which you can read about here. It uses each team’s game-by-game distribution of runs scored and allowed, but treats the two as independent:

The next set is based on Expected W%, that is Pythagenpat:

Finally, CTR based on Predicted W% (Pythagenpat using runs created and runs created allowed. Actually Base Runs. Which as we all know makes what follows worthless because this was “The Year That Base Runs Failed”):

I’ve also started including CTR based on actual wins and losses, but including the playoffs. The playoffs provide us with additional information about team quality even though the manner in which they do so is even more unbalanced than the regular season schedule. It is interesting to take a gander at it:

Even with St. Louis falling in four games in the NLDS and the Royals going 11-5 en route to the World Series title, the two Missouri nines finish in a dead heat on top of the ratings. Chicago really didn’t close the gap with the Pirates, their 0-4 NLCS undoing the gains that their 4-1 mark against their NL Central rivals in the opening rounds of the playoffs would have provided.
The teams sorted by difference between playoff CTR (pCTR) and regular season CTR (rsCTR):

The changes in ratings for non-playoff teams are all for AL teams to increase by one point and NL teams to decrease by one point due to changes in schedule strength. A few NL East teams weren’t affected at all, and neither were Texas, Toronto, and New York despite participating in the playoffs.
Tuesday, January 12, 2016
Hitting by Position, 2015
Of all the annual repeat posts I write, this is the one which most interests me--I have always been fascinated by patterns of offensive production by fielding position, particularly trends over baseball history and cases in which teams have unusual distributions of offense by position. I also contend that offensive positional adjustments, when carefully crafted and appropriately applied, remain a viable and somewhat more objective competitor to the defensive positional adjustments often in use, although this post does not really address those broad philosophical questions.
The first obvious thing to look at is the positional totals for 2015, with the data coming from Baseball-Reference.com. "MLB” is the overall total for MLB, which is not the same as the sum of all the positions here, as pinch-hitters and runners are not included in those. “POS” is the MLB totals minus the pitcher totals, yielding the composite performance by non-pitchers. “PADJ” is the position adjustment, which is the position RG divided by the overall major league average (this is a departure from past posts; I’ll discuss this a little at the end). “LPADJ” is the long-term positional adjustment that I use, based on 2002-2011 data. The rows “79” and “3D” are the combined corner outfield and 1B/DH totals, respectively:

The mid-defensive spectrum positions, third base and center field, both had big years, exceeding the production of left field and coming close to matching combined corner outfield production. It was also a good year for DHs. Pitchers rebounded from their first ever negative RG performance to post a PADJ of 2, better than 2012 or 2014. In 2014 pitchers hit .122/.154/.152, so their .132/.160/.170 performance saw upticks in both BA (+.010) and ISO (+.008).
In examining team performance, let’s start with the least important, the performance of NL pitchers. I need to stress that the runs created method I’m using here does not take into account sacrifices, which usually is not a big deal but can be significant for pitchers. Note that all team figures from this point forward in the post are park-adjusted. The RAA figures for each position are baselined against the overall major league average RG for the position, except for left field and right field which are pooled.

As usual, the spread from best unit to worst is around twenty runs.
I don’t run a full chart of the leading positions since you will very easily be able to go down the list and identify the individual primarily responsible for the team’s performance and you won’t be shocked by any of them, but the teams with the highest RAA at each spot were:
C--OAK, 1B--ARI, 2B--HOU, 3B--TOR, SS--HOU, LF--STL, CF--LAA, RF--WAS, DH--TOR
More interesting are the worst performing positions; the player listed is the one who started the most games at that position for the team:

This list is AL-dominated, with center field the only position where a NL team was last. But the main point of interest here is the futility of the Seattle catchers. They only slightly outperformed San Francisco’s pitchers, and that’s not hyperbole. Giant pitchers hit .169/.189/.294 for 1.39 RG; Mariner catchers hit .165/.214/.269 for 1.44 RG. Mike Zunino was the bright spot, hitting .181/.238/.311 for 2.13 RG in 375 PA as a catcher. The rest of the catchers combined to hit .136/.168/.191 for .24 RG in 197 PA. That RG would have ranked just fifth-best among NL pitching staffs, and was most comparable to the Dodgers (.127/.167/.175 for .20 RG). And every one of them was worse than Zunino (Jesus Sucre 1.02 RG in 133 PA, Welington Castillo -.54 RG in 22, John Hicks -1.08 RG in 31, Steven Baron -2.55 RG in 11).
This chart also makes it apparent why Brett Lawrie was of interest to Chicago, as both of his potential positions were the worst in the majors offensively (I wrote that prior to Todd Frazier also being acquired which means that both gaping holes have been addressed).
I like to attempt to measure each team’s offensive profile by position relative to a typical profile. I’ve found it frustrating as a fan when my team’s offensive production has come disproportionately from “defensive” positions rather than offensive positions (“Why can’t we just find a corner outfielder who can hit?”) The best way I’ve yet been able to come up with to measure this is to look at the correlation between RG at each position and the long-term positional adjustment. A positive correlation indicates a “traditional” distribution of offense by position--more production from the positions on the right side of the defensive spectrum. (To calculate this, I use the long-term positional adjustments that pool 1B/DH as well as LF/RF, and because of the DH I split it out by league):

In a typical seasons there are more teams with negative correlations than this, and Milwaukee’s +.90 r is about as high as you’ll ever see. But that was not a good thing as only their corner outfield spots were above average for their positions. As an Indian fan, it is quite common to see them near the bottom of the list thanks to their now decade-long struggle to put quality bats at the corners (and their success with players such as Grady Sizemore, Jason Kipnis, Carlos Santana, Yan Gomes, and now Francisco Lindor contributing offensively from up-the-middle positions). As a fan it can be frustrating to see a low correlation team and think that if they could just find decent offense at those spots that the offense would be great, but on the whole it’s a curiosity and of course the team’s composite offensive ability is what matters.
The following charts, broken out by division, display RAA for each position, with teams sorted by the sum of positional RAA. Positions with negative RAA are in red, and positions that are +/-20 RAA are bolded:

Toronto had the AL’s best production from corner infielders and infielders as a unit thanks to Josh Donaldson. The bolding illustrates that it was their big three that made this a special offense. Boston had the AL’s worst corner infielders, but I was initially puzzled by Baltimore’s poor showing at DH and not-great 7 RAA at first base despite the presence of Chris Davis. Davis did his best hitting at first base (965 OPS in 454 PA) and actually had more PA as a right fielder than a DH (122 to 94). The other Oriole first basemen, though, combined to hit just .200/.244/.385 over 217 PA. Note that the Yankees got average production at shortstop after having the worst hitting shortstop(s) in the majors in 2014, some guy whose name I can’t recall.

Minnesota had the AL’s worst outfield production, while Chicago’s infield was the worst in baseball (as noted above their second and third basemen were the worst, the latter just edging out Cleveland). I don’t have the energy to write the obvious about Kansas City’s offense, which was average despite good October fortune. Sometimes baseball is dumb.
Houston had the best middle infield production in MLB. I never would have guessed that Seattle was above-average offensively; park illusions and narratives remain powerful things. Nelson Cruz allowed their outfield to lead the AL in RAA, and yet the three outfielders (+37) did not completely offset the horrid catchers (-41). The only team in the majors other than Los Angeles to have just one above-average position was the White Sox; that it was the second-best position in the majors must make Mike Trout really angry sometimes.

Washington had the majors’ most productive outfield thanks to Bryce Harper’s amazing season. Miami had the worst corner infielders in the NL. Remember that these figures are against the major league average, so the Mets aren’t being compared to a lower baseline than the Royals--their position players were better offensively relative to their positions.

The Cubs and Reds tied for the most productive corner infields in MLB, doing it in opposite ways, Chicago with near perfect balance and Cincinnati with a big season from Joey Votto and solid production from Todd Frazier. But the Reds gave it all back with the majors’ worst outfield, led by their center field disaster which they compounded by leading off their center fielders in 75 games (shortstop 66, left field 12, second base 7, right field 2).

As mentioned above, the Angels were below average at eight of nine spots; uptown the Dodgers were the only team without a below average position. Solidly above average everywhere with only one standout position led to the second highest composite RAA in the majors. Their archrivals were right behind with just two less RAA and one below average position, but three positions were standouts and they led the majors in infield RAA and the NL in middle infield RAA. Arizona had the worst middle infield RAA in the majors.
The full spreadsheet is available here.
Monday, January 04, 2016
Hitting by Lineup Position, 2015
I devoted a whole post to leadoff hitters, whether justified or not, so it's only fair to have a post about hitting by batting order position in general. I certainly consider this piece to be more trivia than sabermetrics, since there’s no analytic content.
The data in this post was taken from Baseball-Reference. The figures are park-adjusted. RC is ERP, including SB and CS, as used in my end of season stat posts. The weights used are constant across lineup positions; there was no attempt to apply specific weights to each position, although they are out there and would certainly make this a little bit more interesting:

For the seventh consecutive season, NL #3 hitters are the best position in baseball. It is interesting to note that the NL is superior at the majority of the lineup spots (1, 2, 3, 5, 7), yet the AL holds a slight advantage in RG from spots 1-8 combined (4.49 to 4.45). #2 hitters outperformed #5 hitters in both leagues, although the #5 spots remain home to a higher ISO than #2. Last year AL #6 hitters were quite poor (better than only three other spots); that was just a blip and the AL #6 hitters were easily the best of the eight 6-9 spots in 2015.
Next are the team leaders and trailers in RG at each lineup position. The player listed is the one who appeared in the most games in that spot (which can be misleading, especially for spots low in the batting order where many players cycle through):


The Cubs #8 and #9 spots mess up both the leaders and trailers list for the NL as the former trail thanks to Joe Maddon’s singular devotion to batting the pitcher eighth, which he did for almost every game the Cubs played in a NL park. Last year I noted in this spot that you could see why Seattle wanted Nelson Cruz as they had the AL’s worst cleanup production; Cruz turned that completely around in 2015. As I write this, a Brandon Phillips trade to Washington appears to be in the works and the MLBN commentators are seriously discussing the possibility that Dusty could lead him off. And how sad to see lineup spots led by Joe Mauer, Albert Pujols, and Ryan Howard on the trailers list (ok, the first two are sad, the latter is hilarious).
The next list is the ten best positions in terms of runs above average relative to average for their particular league spot (so AL leadoff spots are compared to the AL average leadoff performance, etc.):

And the ten worst:

I’ve run this report since 2009; -53 is surpassed only by last year’s TEX #3 hitters (for the record, they were +6 in 2015). Again, though, this is essentially comparing a full-time pitcher spot in the order to NL #8 hitters, which include only a smattering of pitchers, so it’s a misleading number (except to the extent that Joe Maddon did punt on his #8 lineup spot).
The last set of charts show each team’s RG rank within their league at each lineup spot. The top three are bolded and the bottom three displayed in red to provide quick visual identification of excellent and poor production:


The full spreadsheet is available here.
Monday, December 21, 2015
Leadoff Hitters, 2015
I will try to make this as clear as possible: the statistics are based on the players that hit in the #1 slot in the batting order, whether they were actually leading off an inning or not. It includes the performance of all players who batted in that spot, including substitutes like pinch-hitters.
Listed in parentheses after a team are all players that started in twenty or more games in the leadoff slot--while you may see a listing like "COL (Blackmon)” this does not mean that the statistic is only based solely on Blackmon's performance; it is the total of all Colorado batters in the #1 spot, of which Blackmon was the only one to start in that spot in twenty or more games. I will list the top and bottom three teams in each category (plus the top/bottom team from each league if they don't make the ML top/bottom three); complete data is available in a spreadsheet linked at the end of the article. There are also no park factors applied anywhere in this article.
That's as clear as I can make it, and I hope it will suffice. I always feel obligated to point out that as a sabermetrician, I think that the importance of the batting order is often overstated, and that the best leadoff hitters would generally be the best cleanup hitters, the best #9 hitters, etc. However, since the leadoff spot gets a lot of attention, and teams pay particular attention to the spot, it is instructive to look at how each team fared there.
The conventional wisdom is that the primary job of the leadoff hitter is to get on base, and most simply, score runs. It should go without saying on this blog that runs scored are heavily dependent on the performance of one’s teammates, but when writing on the internet it’s usually best to assume nothing. So let's start by looking at runs scored per 25.5 outs (AB - H + CS):
1. BOS (Betts/Pedroia), 5.7
2. CHN (Fowler), 5.6
3. STL (Carpenter/Wong), 5.5
Leadoff average, 4.9
28. TB (Guyer/Kiermeier/Jaso), 4.4
ML average, 4.2
29. ATL (Peterson/Markakis), 4.0
30. SEA (Marte/Jackson/Morrison), 3.8
The Rays are the team that stands out here, below average despite a healthy .339 OBA. Otherwise the leaders were above average in OBA and the trailers below average, although they weren’t extreme:
1. CLE (Kipnis), .368
2. HOU (Altuve/Springer), .367
3. CHA (Eaton), .356
4. SF (Aoki/Pagan/Blanco), .353
Leadoff average, .329
ML average, .319
28. KC (Escobar), .297
29. CIN (Phillips/Hamilton/Bourgeois), .291
30. LAA (Aybar/Calhoun/Giavotella), .282
I did include HB in OBA this year, so it is (H + W + HB)/(AB + W + HB).
I recently heard some on MLB Network saying that a key for the White Sox would be Adam Eaton getting back to form. But the Eaton-led Chicago leadoff men were quite solid. They even posted a .138 ISO which was one point better than the average for leadoff hitters, so I’m not sure where the notion that Eaton was the problem with the Chicago offense came from.
Escy-magic alright. But if it magically works for a handful of playoff games, by all means, let’s start a trend towards hacking low OBA leadoff hitters. Maybe the Angels will be the first takers and leadoff Andrelton Simmons--he couldn’t do much worse than their 2015 output.
The next statistic is what I call Runners On Base Average. The genesis for ROBA is the A factor of Base Runs. It measures the number of times a batter reaches base per PA--excluding homers, since a batter that hits a home run never actually runs the bases. It also subtracts caught stealing here because the BsR version I often use does as well, but BsR versions based on initial baserunners rather than final baserunners do not. Here ROBA = (H + W + HB - HR - CS)/(AB + W + HB).
My 2009 leadoff post was linked to a Cardinals message board, and this metric was the cause of a lot of confusion (this was mostly because the poster in question was thick-headed as could be, but it's still worth addressing). ROBA, like several other methods that follow, is not really a quality metric, it is a descriptive metric. A high ROBA is a good thing, but it's not necessarily better than a slightly lower ROBA plus a higher home run rate (which would produce a higher OBA and more runs). Listing ROBA is not in any way, shape or form a statement that hitting home runs is bad for a leadoff hitter. It is simply a recognition of the fact that a batter that hits a home run is not a baserunner. Base Runs is an excellent model of offense and ROBA is one of its components, and thus it holds some interest in describing how a team scored its runs, rather than how many it scored:
1. CLE (Kipnis), .337
2. SF (Aoki/Pagan/Blanco), .326
3. HOU (Altuve/Springer), .324
Leadoff average, .296
ML average, .286
28. SD (Myers/Solarte/Venable), .267
29. LAA (Aybar/Calhoun/Giavotella), .263
30. MIN (Dozier/Hicks), .257
I will also include what I've called Literal OBA here--this is just ROBA with HR subtracted from the denominator so that a homer does not lower LOBA, it simply has no effect. It “literally” (not really, thanks to errors, out stretching, caught stealing after subsequent plate appearances, etc.) is the proportion of plate appearances in which the batter becomes a baserunner able to be advanced by his teammates. You don't really need ROBA and LOBA (or either, for that matter), but this might save some poor message board out there twenty posts, by not implying that I think home runs are bad, so here goes. LOBA = (H + W + HB - HR - CS)/(AB + W + HB - HR):
1. CLE (Kipnis), .343
2. HOU (Altuve/Springer), .332
3. SF (Aoki/Pagan/Blanco), .331
Leadoff average, .303
ML average, .294
28. CIN (Phillips/Hamilton/Bourgeois), .273
29. LAA (Aybar/Calhoun/Giavotella), .267
30. MIN (Dozier/Hicks), .267
Usually the various OBA lists are pretty stable, and that was the case in 2015 as the Indians, Astros, and Giants leadoff hitters were the best at getting on base regardless of any slight differences in one’s definition of “getting on base” in this context.
The next two categories are most definitely categories of shape, not value. The first is the ratio of runs scored to RBI. Leadoff hitters as a group score many more runs than they drive in, partly due to their skills and partly due to lineup dynamics. Those with low ratios don’t fit the traditional leadoff profile as closely as those with high ratios (at least in the way their seasons played out):
1. CHN (Folwer), 2.3
2. CIN (Phillips/Hamilton/Bourgeois), 2.2
3. MIA (Gordon), 2.0
4. TEX (DeShields/Choo/Martin), 1.9
Leadoff average, 1.6
28. ATL (Peterson/Markakis), 1.3
29. SEA (Marte/Jackson/Morrison), 1.3
30. BOS (Betts/Pedroia), 1.2
ML average, 1.1
You may recall that the Red Sox leadoff hitters led the majors in runs scored per out, so seeing them with the lowest R/RBI ratio suggests they drove in a whole bunch of runs. Their 95 RBI easily led the majors (St. Louis was next with 82). Meanwhile, the Braves and Mariners had the lowest runs scored per out, so they got here more conventionally.
A similar gauge, but one that doesn't rely on the teammate-dependent R and RBI totals, is Bill James' Run Element Ratio. RER was described by James as the ratio between those things that were especially helpful at the beginning of an inning (walks and stolen bases) to those that were especially helpful at the end of an inning (extra bases). It is a ratio of "setup" events to "cleanup" events. Singles aren't included because they often function in both roles.
Of course, there are RBI walks and doubles are a great way to start an inning, but RER classifies events based on when they have the highest relative value, at least from a simple analysis:
1. MIA (Gordon), 1.7
2. CIN (Phillips/Hamilton/Bourgeois), 1.3
3. SF (Aoki/Pagan/Blanco), 1.2
Leadoff average, .8
ML average, .7
28. BOS (Betts/Pedroia), .5
29. MIN (Dozier/Hicks), .5
30. STL (Carpenter/Wong), .5
Since stealing bases is part of the traditional skill set for a leadoff hitter, I've included the ranking for what some analysts call net steals, SB - 2*CS. I'm not going to worry about the precise breakeven rate, which is probably closer to 75% than 67%, but is also variable based on situation. The ML and leadoff averages in this case are per team lineup slot:
1. CIN (Phillips/Hamilton/Bourgeois), 28
2. MIA (Gordon), 21
3. COL (Blackmon), 17
4. TOR (Reyes/Revere/Tulowitzki/Travis), 14
Leadoff average, 4
ML average, 1
28. STL (Carpenter/Wong), -8
29. ATL (Peterson/Markakis), -10
30. CLE (Kipnis), -10
Shifting back to quality measures, beginning with one that David Smyth proposed when I first wrote this annual leadoff review. Since the optimal weight for OBA in a x*OBA + SLG metric is generally something like 1.7, David suggested figuring 2*OBA + SLG for leadoff hitters, as a way to give a little extra boost to OBA while not distorting things too much, or even suffering an accuracy decline from standard OPS. Since this is a unitless measure anyway, I multiply it by .7 to approximate the standard OPS scale and call it 2OPS:
1. HOU (Altuve/Springer), 833
2. BOS (Betts/Pedroia), 823
3. CLE (Kipnis), 823
4. BAL (Machado), 815
5. STL (Carpenter/Wong), 812
Leadoff average, 745
ML average, 730
28. CIN (Phillips/Hamilton/Bourgeois), 641
29. KC (Escobar), 640
30. LAA (Aybar/Calhoun/Giavotella), 639
Along the same lines, one can also evaluate leadoff hitters in the same way I'd go about evaluating any hitter, and just use Runs Created per Game with standard weights (this will include SB and CS, which are ignored by 2OPS):
1. BOS (Betts/Pedroia), 5.6
2. HOU (Altuve/Springer), 5.6
3. COL (Blackmon), 5.4
Leadoff average, 4.4
ML average, 4.2
28. CIN (Phillips/Hamilton/Bourgeois), 3.4
29. LAA (Aybar/Calhoun/Giavotella), 3.2
30. KC (Escobar), 3.1
This is as good of a time as any to note that no park adjustments are applied anywhere in this post, which explains the presence of Colorado (St. Louis was the next highest-ranked NL team with 5.3).
Allow me to close with a crude theoretical measure of linear weights supposing that the player always led off an inning (that is, batted in the bases empty, no outs state). There are weights out there (see The Book) for the leadoff slot in its average situation, but this variation is much easier to calculate (although also based on a silly and impossible premise).
The weights I used were based on the 2010 run expectancy table from Baseball Prospectus. Ideally I would have used multiple seasons but this is a seat-of-the-pants metric. The 2010 post goes into the detail of how this measure is figured; this year, I’ll just tell you that the out coefficient was -.217, the CS coefficient was -.584, and for other details refer you to that post. I then restate it per the number of PA for an average leadoff spot (742 in 2014):
1. HOU (Altuve/Springer), 19
2. COL (Blackmon), 19
3. BOS (Betts/Pedroia), 19
Leadoff average, 3
ML average, 0
28. CIN (Phillips/Hamilton/Bourgeois), -14
29. LAA (Aybar/Calhoun/Giavotella), -19
30. KC (Escobar), -20
The Mets (Granderson) were the top non-Coors NL team at 16. Just to think that a few years ago Billy Hamilton was being hyped as a potential leadoff dynamo, the Angels had Mike Trout doing leadoff duties, and Alcides Escobar…well, I’m pretty sure everyone thought he would be a terrible leadoff hitter.
The spreadsheet with full data is available here.
Tuesday, December 15, 2015
Statistical Meanderings 2015
This is an annual, largely analysis-free look at some things that I found interesting when compiling my end of season statistical reports. My whole series of annual posts will be a little late and a little brief thanks to some computer issues that prevented me from working on them for a few weeks. They might be the better for it:
* Minnesota was 46-35 at home and 37-44 on the road, close to an inverse record. Nothing noteworthy about that. More amusing is that they almost had an inverse R-RA, scoring 373 and allowing 323 at home while scoring 323 and allowing 377 on the road.
* Every year I run a chart showing runs above average (based on park adjusted runs per game) for each playoff team’s offense and defense. Usually I do this and get to slyly point out that the average playoff team was stronger offensively, but that is not the case this year, and it would be bad form not to show it even when there are no guffaws to be had:

Although it is interesting narrative-wise that the Mets’ offense wound up being twenty runs better than their defense.
* There were nine teams whose starters had a lower eRA than their relievers, led by the Dodgers (3.67/4.36) and also including the A’s, Red Sox, Mariners, Cubs, Rays, Braves, Cardinals, and Mets. One might note that four of the five NL playoff teams are represented; only the Pirates had a lower bullpen eRA (4.09/3.50).
In 2014 there were eight teams with a lower starter eRA and two made the playoffs; in 2013 seven with two playoff participants; in 2012 five with just one playoff club; and in 2011 eight and two.
I certainly would not claim that this little piece of trivia demonstrates any larger truth about the importance of starters and relievers, but it certainly is the kind of factoid that could be used in the style of a Verducci to do so. Of course, the blessed Royals completely break the narrative as the team with the biggest difference in favor of their relievers (4.74/3.34; that 1.39 run gap was much higher than the next closest team, the Brewers (4.92/3.88)).
It is also interesting to see the Rays on the list given the attention they got for aggressively pulling starters on the basis of times through the order. Tampa was 23rd in the majors in innings/start, but second to last in the AL (TB starters worked 5.65 innings per game, KC 5.63).
* Speaking of things you’re probably not supposed to say about the Royals, they were an excellent fielding team with a .690 DER, fourth in the majors. But the two teams they best in the AL playoffs each had a better DER (TOR .696, HOU also .690; San Francisco led the NL at .694).
* Minnesota starters had a 4.68 eRA, above the AL average of 4.47 and in the bottom third of the circuit. But this was a big improvement from their deplorable pitching of the last three seasons. That leaves Philadelphia as the team that can make everyone else feel good about their rotations. Phillie starters had a 5.59 eRA, much worse than their closest competition, Colorado at 5.08 (these figures are all park-adjusted). Rockie starters were last in IP/S (5.29, .2 innings fewer than PHI and ARI) and QS% (33%, MIL at 39% and PHI at 41%).
* If you’d have given me ten guesses, I’m not sure I would have come up with San Francisco leading the majors in park adjusted OBA (.342). In my defense it was a BA-driven performance as their .278 BA was nine points better than Detroit and their walk & hit batter per at bat ratio was .097, just three points above the NL average.
* Dellin Betances and Andrew Miller were 1-2 among AL relievers in strikeout rate. Granted he and Miller wouldn't have both been in the same bullpen, but David Robertson was third.
* Evan Scribner had one of the craziest lines you will ever see. He struck out 64 and walked 4 in 60 innings, but he yielded 14 homers, so he was sub-replacement level (I have him at -4 RAR, which is based on runs allowed adjusted for inherited and bequeathed runners). Scribner had the best K/W ratio among relievers; the next best was Kenley Jansen at 80/8.
If you rank AL relievers by the difference between strikeout and walk rate ((K-W)/PA), a better metric, Scribner ranks eighth. The seven relievers ahead of him were all at least 15 RAR except David Robertson (6). The next sub-replacement level relievers on the list are Aaron Loup (17th) and Mike Morin (19th), but both of them were hit-unlucky (.352 and .353 BABIP respectively) and comfortably above average in dRA. To find the next sub-replacement level performance you have to go all the way down to 46th and Danny Farquhar.
Scribner's 2.2 HR/G (games based on 37 PA rather than 9 IP) rate was the highest among major league relievers. The top three AL relievers in HR rate were all A's: Fernando Abad (2.0) and Edward Mujica (1.9), but OAK's HR park factor of 93 is tied for lowest in the AL.
* My stat reports set a minimum of 40 relief appearances to be included as a reliever, but sometimes I cheat and let in players I’m interested in. One case this year was Jeff Manship. Manship pitched 39 1/3 innings over 32 games. But if you include him, he:
1. Led in RRA (.67 to Wade Davis’ ridiculous .75 over 67 1/3 innings)
2. Led in eRA (1.51 to Davis’ 1.79)
3. was 13th in dRA (2.92, teammate Cody Allen led the way at 2.24)
4. And as you probably surmised by now, led the AL in lowest BABIP (.194, Will Harris was next at .201. Manship’s teammate Allen of the league-leading dRA gave up a .348, eleventh worse of the 95 AL relievers)
Terry Francona frequently used Allen in the eighth inning. Allen’s .37 IR/G was fifth among AL relievers with double digit saves, and Roberto Osuna was the only one of those five with twenty or more saves (twenty on the nose and .49 IR/G). Allen allowed only 4/26 inherited runners to score, lowering his 3.38 RA to a 2.86 RRA
* Does Jerry DiPoto know that Joaquin Benoit had a .190 BABIP? (That's not intended as shot at Jerry DiPoto, Benoit was in the news so it stood out.)
* Ground zero for DIPS intrigue was Toronto. Toronto led the majors with a .696 DER, and their starting pitchers with 15 starts were:
1. Marco Estrada, who had the highest ratio of dRA/eRA (basically, my DIPS run average to a component run average, both based on the same Base Runs formula but the latter considering actual singles, doubles, and triples allowed) of any AL starter (4.73/3.40) thanks to a .223 BABIP
2. RA Dickey, who ranked eighth with 4.72/4.00 and as a knuckleballer falls in one of the first categories of pitchers Voros McCracken carved out of DIPS theory
3. Mark Buehrle, whose dRA/eRA ratio in his final (?) season was an unremarkable 4.52/4.41 but who over the course of his career was an occasional DIPS lightning rod
4. Poor Drew Hutchison, who had the third lowest ratio at 4.46/5.50 and was pounded for a .344 BABIP. On the other hand, he had a 13-5 record despite his BABIP-fueled -6 RAR (second worst in the league, ahead of only...)
* One of the more amusing bits of media silliness during 2015 was Bill Madden's fixation on Shane Greene, which included a caption on an article that asked if Shane Greene was Brian Cashman's biggest mistake, and Madden pondering whether the Yankees would still rather have Nathan Eovaldi and Didi Gregorius than Greene and Martin Prado.
Greene was the worst starting pitcher in the AL with -13 RAR.
I like that as a punchline, but the alternate punchline is that while Prado hit fine (20 RAR) for Miami, Gregorius hit enough (only -3 RAA versus an average shortstop) and gave New York their first good fielding shortstop in goodness knows how long, while Eovaldi chipped in 22 RAR. 36 RAR to 7 RAR, I think Cashman is pretty happy with his choices.
* I will point out that my RAR formula includes no leverage adjustment (which I defend), but then leave this without further comment because you can get chastised for talking about this:
2015 RAR
Jake Odorizzi +36
Wade Davis +30
James Shields +26
Wil Myers +14
* Would you concur that it’s plausible that all five of these seasons could have been produced by the same pitcher?

These are by no means the five most similar in value seasons you could pull out of this year’s pitching lines, but they are broadly similar, no? The reason I like this group so much is that the pitchers are John Lackey, Shelby Miller, Jaime Garcia, Carlos Martinez, Lance Lynn, and Michael Wacha. Not only did St. Louis use five clones as their rotation, they traded a sixth away.
* Ichiro was last in the NL in RAR as a 42 year old corner outfielder. His batting average--Ichiro's batting average--was .229. It is almost inconceivable that he will get another job and that my Twitter feed will react with anything but scorn. But sometimes the inconceivable is reality.
* Speaking of Marlins with terrible secondary averages, Dee Gordon posted a .128, same as Suzuki. The only NL hitters with 250 PA and SECs lower than .128 were Milwaukee's sometimes double play combination of Jean Segura (.110) and Hernan Perez (.101). Ben Revere posted a .128 as well, and both Revere and Gordon were above average offensively, but the next lowest SEC by an above-average NL hitter was .151 (Brandon Phillips). I remain skeptical about Gordon's long-term outlook; it is exceedingly rare for a player to be able to remain an offensive contributor with so little to offer other than singles.
Nonetheless, for 2015, Gordon was a defensible choice for the Silver Slugger, as only Joe Panik had a higher RG and he compiled 220 fewer PA. Still not a good look for NL second basemen.
* The Speed Score trajectories of Bryce Harper and Mike Trout have been something I’ve been watching as much has been made of Trout reconstituting his offensive game as more of a power hitter and less of a baserunning threat. But as of last year his Speed Score was still quite high, albeit lower than when he broke in. With a fourth season under his belt, Trout’s Speed Score sequence is 8.7, 7.0, 7.2, 4.9. So 2015 did mark a significant downturn in terms of Trout’s speed manifesting itself through the official statistics (or at least stolen base percentage, stolen base attempt frequency, triples/BIP, and runs scored per time on base).
Meanwhile, Harper’s sequence is 7.5, 4.9, 2.7, 3.0. If that keeps up Dusty Baker will accuse him of clogging the bases.
* The best season you probably weren’t aware of (which is really to say the best season I wasn’t aware of): Logan Forsythe hit .287/.370/.454 over 609 PA, good for 39 RAR. It was basically the same season as Jason Kipnis had trading some BA for SEC.