See the intro to this series for a fuller explanation of the terminology and purpose of this data.
First, here are the actual W-L records of each pitcher, along with Mate, and Wins Above Team as figured by the Oliver and Deane approaches:
Career Mate is figured by weighting each year’s Mate by the percentage of lifetime decisions the pitcher earned in that year. You can see that very few of these pitchers were with bad teams on balance.
A little note on figuring these for a career. Since Oliver and Wood are strictly linear formulas, the result of figuring WAT or WCR is the same if one looks at each year separately and sums them up, or if the Career W% is compared to Career Mate. However, for Deane, the result will not be the same because a different formula is used depending on whether or not W% > Mate. I have figured career NW% for Deane by comparing to Career Mate, but have figured career Deane WAT by summing each year, because I believe this is how Total Baseball does it, and I want to match the published figures. However, my figures do not match TB in all cases, which is likely the result of data entry error on my part, although I certainly tried to be careful and have corrected any errors that I have caught. You can decide whose figures you want to go by.
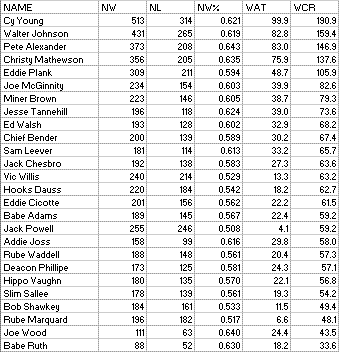
Now Neutral Wins and Losses, NW%, WAT, and WCR under the Wood assumptions (list is sorted by WCR). Neutral Wins and Losses assume that the pitcher has the same number of decisions as he actually did, but wins them at his NW% instead of his actual W%:
I don’t want to get too carried away with discussion of larger truths based on these figures, as they are just a very minor part if any of how I would go about a full evaluation of pitchers, but a few points. Rube Marquard’s W-L record is not particularly impressive for a pitcher of this class. But in the Neutral measures, you can really see that he stands out as sub-par. He is over nine wins v. replacement behind the nearest HOF pitcher (Waddell), and nearly seven wins v. average behind the nearest HOF pitcher (Willis). His NW%, just like his regular W%, is the lowest here among the Hall of Famers. Addie Joss is a guy who ranks ahead of six pitchers in WAT whom he trails in WCR, fitting his short but brilliant career. We don’t kick any of the 300 game winners out of the club, and we don’t add any new members. Mathewson and Plank lose ground for pitching on good teams, while Young and Alexander barely move as they pitched on average teams, and Walter Johnson does well as he pitched for poor teams.
However, the Big Train loses almost seven wins above team versus the Deane approach, as I move the team towards .500 a lot more then Deane does. The traditional methods overstate the effect, be it giving too much credit for those on bad teams or not enough for those on good teams. Miner Brown takes a big hit here, but the Cubs teams he pitched for were probably not very well balanced between offense and defense. I believe he would do better if we adjusted based solely on the quality of offense, and he would also do better in a run/earned run/estimated run evaluation.
Babe Ruth and Joe Wood don’t really meet my criteria for this project, but I was curious about them so they are here. BTW, Wood’s ridiculous 34-5 season in 1912 comes out here as 31-8, good for +16.3 WCR, topped by only a handful of seasons in this period (including Chesbro in 1904, +19.8; Johnson in 1913, +19.5; Walsh in 1908, +18.7; Mathewson in 1908, +16.5; and matched by Cy Young in 1901).
Jack Powell is here as an interesting case, a pitcher with a .489 W% on .462 teams. I didn’t list NW% under the Oliver and Deane assumptions, but Oliver would convert that to .527, while my approach is much more conservative and puts him at .508. You will see that the more conservative approach, in many cases, is not that far removed from a pitcher’s actual record.
I don’t consider this a surprise. If you think about, when a pitcher is in the game, he is basically half of the team (again, at least while he is actually pitching and not relieved). Even if you pitch with a bunch of stiffs for offensive teammates, you have a great deal of control over whether you win or lose. Likewise, even if you pitch for a good offense, you have to hold up your end of the bargain to put up a good record.
Thursday, January 11, 2007
Career WAT Data, 1900-1919
Subscribe to:
Post Comments (Atom)


No comments:
Post a Comment
I reserve the right to reject any comment for any reason.