NOTE: For some reason the charts don't look as nice this time and are tough to read. If you can't read them, click on them and they will come up in full size.
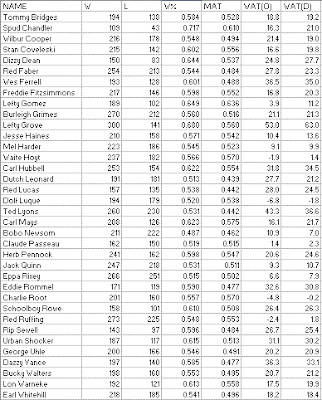
Again, we’ll begin with actual W-L record and percentage, along with Mate and WAT as figured by Oliver and Deane:
Here we have the first pitchers we have encountered who were worse then their teammates, two of them Hall of Famers: Waite Hoyt and Red Ruffing, along with Dolf Luque and Charlie Root. The reason that you can be worse then your teammates and still have a positive WAT figure according to Deane’s methodology is that the method is non-linear, and considering each season separately as I have here produces a different result then figuring the career as a whole. Both Ruffing and Hoyt would have negative WAT(D) if figured for the career as a whole.
Hoyt is an interesting case for other reasons; before doing this study, I had read that Ruffing was the only Hall of Famer with a worse record then his teammates. That is true, if you figure it as most people do. Waite Hoyt’s teams, when he did not pitch, were 2004-1654, for a .548 W%, while Hoyt was 237-166 for a .566 W%. But what I do is weight each season’s Mate by the percentage of career decisions the pitcher earned that year.
I think it is obvious that this is the logically correct way to do it, but I’ll do an example just to illustrate. Suppose there was a pitcher who went 10-10 on a 86-76 team one season, and 1-0 on a 70-92 team the next. His teammates without him would be 86 + 70 -10 - 1 = 145 and 76 + 92 - 10 = 158, for a .479 W%, while our pitcher is 11-10 for a .524.
But what sense does it make to treat equally a season in which he recorded 20 decisions with one in which he recorded 1? Absolutely none. So I would say that his career Mate is 20/21*(86/162) + 1/21*(70/162) = .526. And so this pitcher is actually worse then his teammates.
In the first edition of the Historical Baseball Abstract, Bill James figured WAT by the Oliver method for a number of pitchers, and listed Career Mate as well. I don’t know why our figures diverge in many cases, but they do. For instance, he lists Hoyt’s Mate as .587, while I say it is .570 by my method and .548 by the incorrect method. Perhaps he was weighting by games or innings or something, I don’t know. Or it could be a data entry error on my end. Anyway, we do agree for a number of pitchers, so I think he was using a logical process, but I’d like to find the cause of this divergence. Anyway, it does appear that he did think about this problem the same way I did, and came to the same (IMO common sense) conclusion.
And the Wood/Patriot methodology results:
Here we lose our first 300 game winner, with Lefty Grove dropping out of the club, while still towering over his contemporaries and putting up the best NW% we’ve yet encountered. As a matter of fact, Grove has the highest NW% for any retired pitcher I’ve checked (limiting it to pitchers with 150 neutral wins--Spud Chandler’s .662 in just 152 decisions is higher), but is currently behind three active major league pitchers--it remains to be seen whether they can maintain their standing as they age (I will save their identities for a later installment, but I would think that you figure out for yourself who they are, or at least list a small group of current pitchers that they must be drawn from).
Dolf Luque skates on thin ice, narrowly avoiding the dishonor of being the first sub-.500 NW% pitcher I included in my list.
Monday, January 15, 2007
Career WAT Data, 1920-1945
Subscribe to:
Post Comments (Atom)


No comments:
Post a Comment
I reserve the right to reject any comment for any reason.