Here I’m just going to have a little fun with the idea of “discounted team achievements” I discussed in this post. The basic thing you need to know is that I decided to deflate past achievements by 3% per year, compounding. So a game won three years ago is now, in today’s equivalent, 1/(1.03^3) = .915 wins.
Here we are going to examine Discounted Team Championships, where the championships are of the World Series variety. There is no credit given for a pennant, a playoff appearance, or a good regular season. The base year is 2006, so the Cardinals’ win is worth a full 1 championship. The White Sox’ occurred one year prior to the base year, so it is worth 1/1.03. The Red Sox’ 1/1.03^2, the Marlins 1/1.03^3, the Angels 1/1.03^4, and so on. Then we just sum these for all of the teams that have ever won the World Series, and we have the franchise total.
For simplicity’s sake, I have defined the franchise as the entity, regardless of where they played, so the Boston/Milwaukee/Atlanta Braves are all considered “ATL”, the old(est) Senators are the Twins, etc. So which franchises fans should, under this model, have the most satisfaction from all of their teams’ championships?
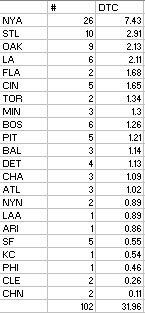
Not surprisingly, the Yankees are #1, and the Cardinals, the only other team with double-digit WS wins and the defending champs are #2. The #3 A’s may seem surprising, but remember that they have won four titles in the last thirty-five years, which means that any A’s fan from 45 up should have experienced a good share of WS wins. On the flip side, it is not surprising that the Indians and the Cubs bring up the rear, as they have had the longest droughts and each have only one additional title to go along with the most recent.
An interesting question is how long would the Yankees have to go without winning the World Series in order to fall behind the Cardinals on this list? Of course, the Cardinals standing will change over that period, as will all of the teams, some up and some down. But the point is not to compare the Yankees to the Cardinals; it is to say “How long would the Yankees have to go before their fans’ satisfaction would be lower then the next-best alternative as of 2006?”
The answer is 2038. Now if the Yankees go another 31 years without winning it all, there are going to be a lot of angry New Yorkers. Which is an opportunity to emphasize again that the 3% rate is a figure chosen because it made sense to me. It may only model the way I think; I certainly wouldn’t claim that it is “correct” in any sense, or that others should think this way. From the sports culture, it would seem that Yankees fans (and even their owner) have a much higher deflation rate. Maybe Yankees fans set the rate at 10%, while Cubbies fans are more patient and would set it at .05%. Of course all of these would vary among the individuals that make up those fan bases as well.
The Yankees would also lead the list today over the Cardinals had they not won a title since 1977. The five that they have won since then have only served to advance their lead over the Cards from 3.82 DTC from 21 real titles to their current 7.43/26.
The point, again, is that this is an exercise done in fun, not to make any hard conclusions about everything. It’s just a different way of thinking about comparing team histories while placing more emphasis on recent performance.
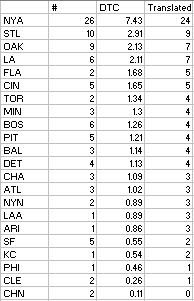
There have been 102 World Series, and the sum of the discounted titles is 31.96. With this, we can see that the ratio is 3.2 real titles/discounted titles. We can multiply each franchise’s DTC by 3.2 to put it on an equivalent scale to actual titles. That gives us this list:
We can use either the ratio of actual titles to DTC or the difference between the actual titles and the DTC equivalents to find the teams that have gotten the most bang for the buck for their titles. The difference is easier to process as a number, but it also favors larger numbers for teams with large number of titles. The Yankees have 2 less DTC equivalent titles then actual titles; they still have 24 DTC equivalent, which is not going to cause anyone to shed any tears for them. So by ratio:
Looking at this list, we can see that the most fortunate teams are recent winners of their only championship(s), which is not exactly a surprise, but it accounts for the Angels, Diamondbacks, Marlins, Blue Jays, Royals, and Phillies. On the flip side, we can see that the Cubs and the Giants have the greatest disconnect between what it says in the record book and the amount of satisfaction their current fans have received from it. My Indians also stand out; I hope to see this rectified some time in the near future.
Friday, June 01, 2007
Discounted Team Championships
Subscribe to:
Post Comments (Atom)


This is very interesting. Here's something to consider to try to make this a bit more complicated and "accurate".
ReplyDeletePresuming that a fan can only appreciate a World Series once he's 12 years old, then any World Series won by a team prior to today would count as 0 for those fans. All 13 year olds will only appreciate a World Series won in the last year, etc, etc.
Secondly, your discount rate can apply (be it 3% or 10% or whatever). That part doesn't change.
Then, you simply multiply the frequency of each group by the discounted championships that you figured for that age group, and all them all up for each age group.
This will give you the average discounted championship for the average living fan.
A variation on this is exponential smoothing, which you could apply to winning percentage as well. Your current state equals x (x a number between 0 and 1, reflecting the discount rate) times your current period's value (could be championships, fractional championships (e.g., 1 for WS title, .5 for WS loss, .25 for playoffs), winning percentage) plus (1-x) times last month's state. March forward in time and keep track.
ReplyDeleteAn advantage of this is that it always gives you a value between 0 and 1 that means exactly what your measure is. Instead of the Cubs having "1378 discounted wins", they would have a .469 discounted winning percentage.
This method is used for performance measures tracked by inspectors employed by the government to track aviation safety.