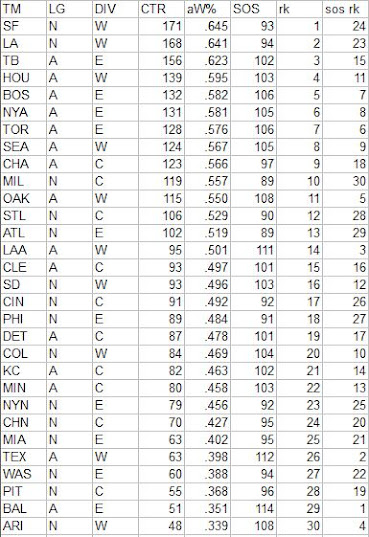
Crude Team Rating (CTR) is my name for a simple methodology of ranking teams based on their win ratio (or estimated win ratio) and their opponents’ win ratios. A full explanation of the methodology is here, but briefly:
1) Start with a win ratio figure for each team. It could be actual win ratio, or an estimated win ratio.
2) Figure the average win ratio of the team’s opponents.
3) Adjust for strength of schedule, resulting in a new set of ratings.
4) Begin the process again. Repeat until the ratings stabilize.
The resulting rating, CTR, is an adjusted win/loss ratio rescaled so that the majors’ arithmetic average is 100. The ratings can be used to directly estimate W% against a given opponent (without home field advantage for either side); a team with a CTR of 120 should win 60% of games against a team with a CTR of 80 (120/(120 + 80)).
First, CTR based on actual wins and losses. In the table, “aW%” is the winning percentage equivalent implied by the CTR and “SOS” is the measure of strength of schedule--the average CTR of a team’s opponents. The rank columns provide each team’s rank in CTR and SOS:
This was not a great year for the playoff teams representing those that had the strongest W-L records in context as Toronto, Seattle, and Oakland all were significantly better than St. Louis and the world champs from Atlanta. The reason for this quickly becomes apparent when you look at the average aW%s by division (I use aW% to aggregate the performance of multiple teams rather than CTR because the latter is expressed as a win ratio—for a simple example a 90-72 team and a 72-90 team will end up with an average win ratio of 1.025 but their composite and average winning percentages will both be .500):
The NL East, despite being described by at least one feckless prognosticator as “the toughest division in baseball”, was in fact the worst division in baseball by a large margin. Atlanta had the second-weakest SOS in MLB, turning their lackluster 88-73 record into something even less impressive in context. In defense of the Braves, they did lose some significant pieces to injury and have a multi-year track record of being a strong team, as well as looking better when the CTRs are based on expected record (i.e. Pythagenpat using actual runs/runs allowed):
Here we see the Dodgers overtake the Giants by a large margin as MLB’s top team, and it actually lines up better with the playoff participants as the Braves rank highly and the Mariners drop.
One weakness of CTR is that I use the same starting win metric to calculate both team strength and strength of schedule in one iterative process. But one could make the case that in order to best put W-L records in context, it would make more sense to use each team’s actual W-L record to determine their ranking but use expected W% or some other measure to estimate strength of schedule. Such an approach would simultaneously recognize that a team should be evaluated on the basis of their actual wins and losses (assuming the objective is to measure “championship worthiness” or some similar hard-to-define but intuitively comprehensible standard), but that just because an opponent had “good luck” or were “efficient” in converting runs to wins, they didn’t necessarily represent a stronger foe. This would give a team credit for its own “efficiency” without letting it accrue credit for its opponents “efficiency”
This is what the ratings look like using predicted W% (using runs created/runs created allowed) as the starting point:
Finally, I will close by reverting to CTRs based on actual W-L, but this time taking the playoffs into account. I am not a big fan of including the playoffs - obviously they represent additional games which provide additional information about team quality, but they are played under very different circumstances than regular season games (particular with respect to pitcher usage), and the fact that series are terminated when a team clinches biases the W-L records that emerge from series. Nonetheless, here they are, along with a column showing each team’s percentage change in CTR relative to the regular season W-L only version. Unsurprisingly, the Braves are the big winner, although they still only rank twelfth in MLB. The biggest loser are the Rays, although they still rank #3 and lead the AL. The Dodgers rating actually declined slightly more than the Giants despite winning their series; they end up with a 6-5 record weighing down their regular season, and with seven of those games coming against teams that are ranked just #12 and #13, the uptick in SOS was not enough to offset it.


No comments:
Post a Comment
I reserve the right to reject any comment for any reason.