The first obvious thing to look at is the positional totals for 2021, with the data coming from Baseball-Reference. "MLB” is the overall total for MLB, which is not the same as the sum of all the positions here, as pinch-hitters and runners are not included in those. “POS” is the MLB totals minus the pitcher totals, yielding the composite performance by non-pitchers. “PADJ” is the position adjustment, which is the position RG divided by the total for all positions, including pitchers (but excluding pinch hitters). “LPADJ” is the long-term offensive positional adjustment, based on 2010-2019 data (see more below). The rows “79” and “3D” are the combined corner outfield and 1B/DH totals, respectively:
Wednesday, December 01, 2021
Hitting by Position, 2021
Having reviewed this data annually for about fifteen seasons, I would strongly caution about drawing any conclusions about shifting norms from single season results, which are better treated as curiosities (and as strong warnings against using single-year or other short time period averages in developing any kind of positional adjustment for use in a player value system). The most interesting curiosity then is shortstops outhitting left fielders, essentially even with third basemen and even DHs. The bumper crop of free agent shortstops has accentuated recognition of the current strength of the position, and their collective 2021 offensive performance lives up to the hype.
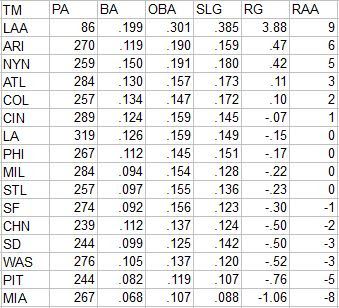
However, I think the most interesting group is the pitchers. The lowest PADJ ever recorded by pitchers was -5 in 2018; they rebounded to 0 in 2019 and now fell back to -4 after taking a year off. This on its face should not be surprising, but remember that pitcher performance was buoyed by Shohei Ohtani. What would it look like sans Ohtani?
While Ohtani had only 65 PA as a pitcher (1.48% of all pitcher PA), he accounted for 6% of their doubles, 5% of their runs, RBI, and walks, and 17% of their home runs). Ohtani’s hitting as a pitcher paled in comparison to what he did as a DH, although he still created runs at 13% better rate than the MLB non-pitcher positional average. Without Ohtani, pitchers would have set a new low with a -6 PADJ. It’s interesting to consider that if the DH is made universal in the new CBA, future seasons’ data will likely show pitchers combine for competent offensive performances.
My next table is usually total pitcher performance for NL teams, but such a display would be incomplete without including the Angels. All team figures from this point forward in the post are park-adjusted. The RAA figures for each position are baselined against the overall major league average RG for the position, except for left field and right field which are pooled:
The teams with the highest RAA by position were:
C--SF, 1B--SF, 2B--LA, 3B--ATL, SS--SD, LF--CIN, CF--BAL, RF--PHI, DH--LAA
Those are pretty self-explanatory although it’s fun that Shohei Ohtani is essentially responsible for two of his teams positions ranking #1--let’s see Boster Posey or Brandon Belt do that!
I find it more entertaining to gawk at the teams that had the lowest RAA at each position (the listed player is the one who started the most games at the position, which does not always mean they were most responsible for the dreadful performance):
Hunter Dozier pulled the reverse Ohtani as the leading starter at third and right; he hit .213/.286/.390 with 3.7 RG, so it wasn’t really his fault. It’s kind of sad to see Miguel Cabrera leading the Tigers DHs to oblivion, and it kind of was his fault. Cabrera’s overall line (.256/.321/.386 for 4.2 RG) wasn’t that bad, but in 180 PA as a first baseman he posted a 844 (unadjusted) OPS while in 335 PA his OPS was just 617.
The next table shows the correlation (r) between each team’s RG for each position (excluding pitchers) and the long-term position adjustment (using pooled 1B/DH and LF/RF). A high correlation indicates that a team’s offense tended to come from positions that you would expect it to:
I didn’t dig through years of these posts to check, but Kansas City’s negative correlation may be the lowest I’ve ever seen. The Royals only above average positions were catcher, second base, and shortstop.
The following tables, broken out by division, display RAA for each position, with teams sorted by the sum of positional RAA. Positions with negative RAA are in red, and positions that are +/-20 RAA are bolded:
A few notes:
* Only five of the fifteen AL teams had positive RAA from their position players, while each NL division had three teams with positive RAA.
* Baltimore’s infield production was the worst in the majors at -91 runs, and only Cedric Mullins’ center field prevented them from having below average performance at all positions. Texas was saved from the same fate only by their right fielders who were just +1 run; the Rangers poor production is impressive for how consistently bad it was across the board.
* Their Texas neighbors were the opposite in displaying consistently good production across the board; Houston’s outfield was the best in the majors at +63 runs, while their infield was second in the AL to Toronto.
* San Francisco and Los Angles were nearly mirror images of each other; the Dodgers narrowly edged the Giants for the top infield in MLB (+89 to +87), while their outfielders were both slightly above average (+5 to +4). LA catchers were outstanding (their 25 RAA tied for second in the majors with the Blue Jays and ChiSox), but the Giants were better at 32 RAA, giving them a three run edge for the majors top total positional RAA.
A spreadsheet with full data is available here.
Subscribe to:
Post Comments (Atom)


No comments:
Post a Comment
I reserve the right to reject any comment for any reason.